

Table of Contents
By Nick Schäferhoff - Last update on
Google PageSpeed Insights (PSI) is a free website performance analysis tool. It scores your site’s loading speed and user experience and gives you actionable tips on how to improve them. Google uses the same information, especially the Core Web Vitals, to determine your pages’ position in the search results.
In this post, we’ll give you a detailed breakdown of what Google PageSpeed Insights is, the information it provides, and how to use it to make your website better.
| 📦 TL;DR ✅Google PageSpeed Insights (PSI) is a free tool for web performance testing and measuring Core Web Vitals. It helps you understand your site’s loading speed, user experience, accessibility, best practices, basic SEO, and AI agent compatibility. ✅ PSI provides both simulated web data and, when available, real-life data based on the Chrome User Experience (CrUX) report. It lists specific performance problems, including the files and page elements that cause them, as well as potential solutions. ✅ A central part of the performance report is the Core Web Vitals metrics. Focus on receiving a passing grade here rather than chasing a perfect 100/100 score. Additionally, prioritize mobile performance and global improvements before page-specific changes. ✅ WP Rocket and Imagify are two WordPress plugins that help improve your PageSpeed Insight results and Core Web Vitals without any coding. WP Rocket applies 80% of performance best practices automatically upon activation and offers additional one-click improvements. Imagify helps resolve image-related warnings by automatically compressing image files and converting them to next-gen formats like WebP or AVIF. ✅ Monitor performance over time and test with real users to ensure improvements translate to better actual experience, not just higher lab scores. |
What is Google PageSpeed Insights?
PageSpeed Insights (PSI) is a free tool created by Google to analyze and improve the performance and user experience of web pages. It’s based on Lighthouse, another open-source tool developed by Google.
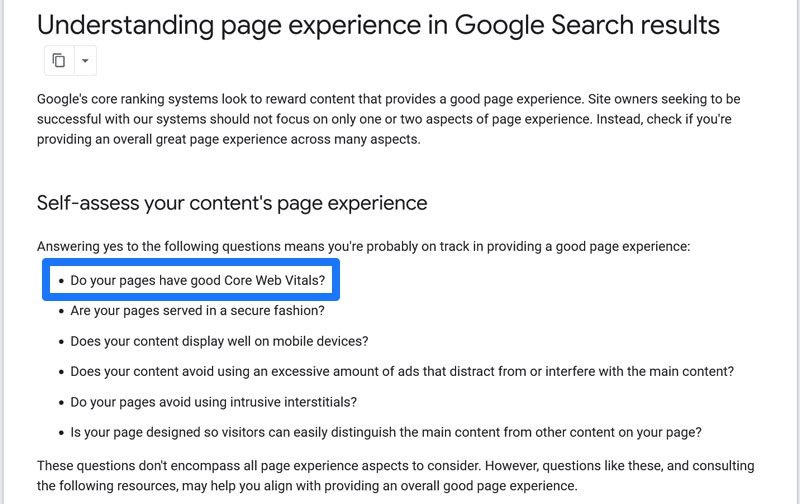
Following its advice not only helps make your website load faster, it’s also good for your SEO. Google uses the same information displayed in PSI to determine search rankings. Core Web Vitals in particular directly impact your pages’ visibility in search results.
Using Google PSI is conceivably easy. Simply go to the tool’s homepage, enter the URL of the page you want to test in the top bar, and hit the enter key or click Analyze.
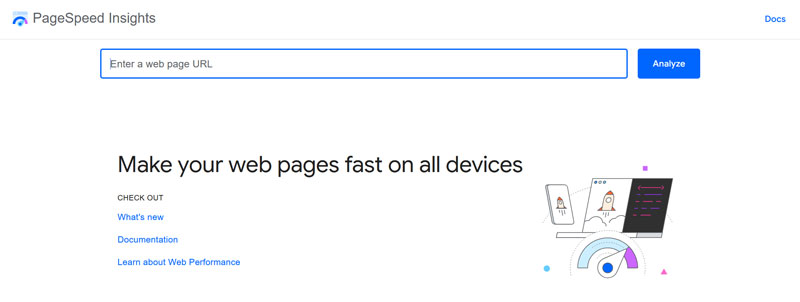
You usually receive a complete report in less than a minute.
How to Read Each Section of Your Report
The PageSpeed Insights report consists of several parts. Here’s what they each contain.
Mobile vs Desktop Performance
At the top, you can switch between the report for the mobile and desktop version of your site.
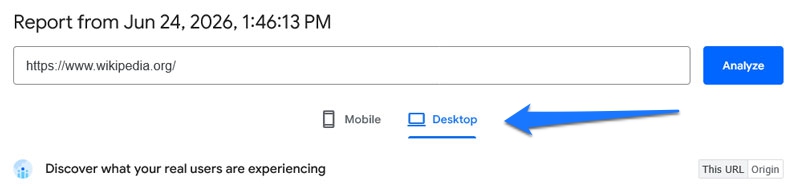
PageSpeed Insights tests them separately. Mobile devices tend to have less computing power and slower internet connections than desktop computers, making web pages load more slowly on mobile.
The tool lists mobile results by default because the majority of internet traffic comes from phones and tablets.
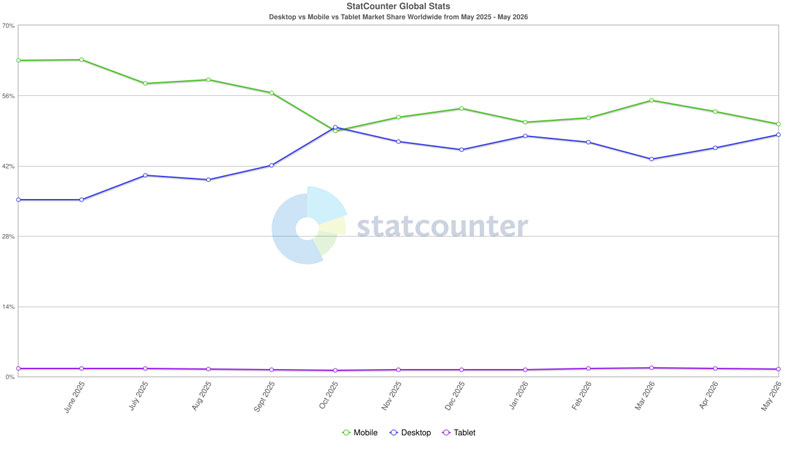
Additionally, Google uses a mobile-first search index, meaning search rankings are determined by the mobile version of your site.
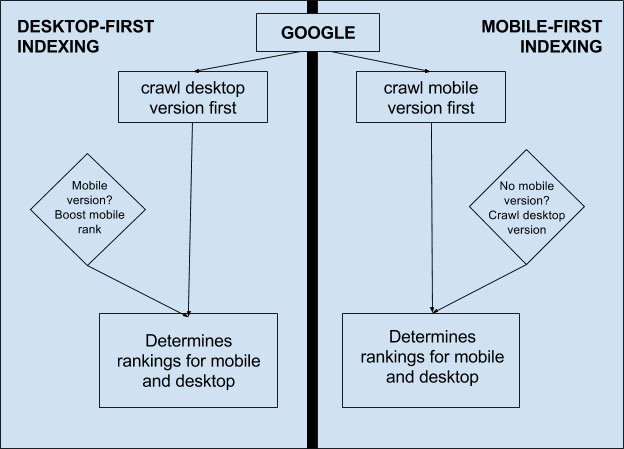
Finally, most improvements you make for mobile performance carry over to the desktop version, so if you improve your mobile performance, desktop visitors also benefit from it.
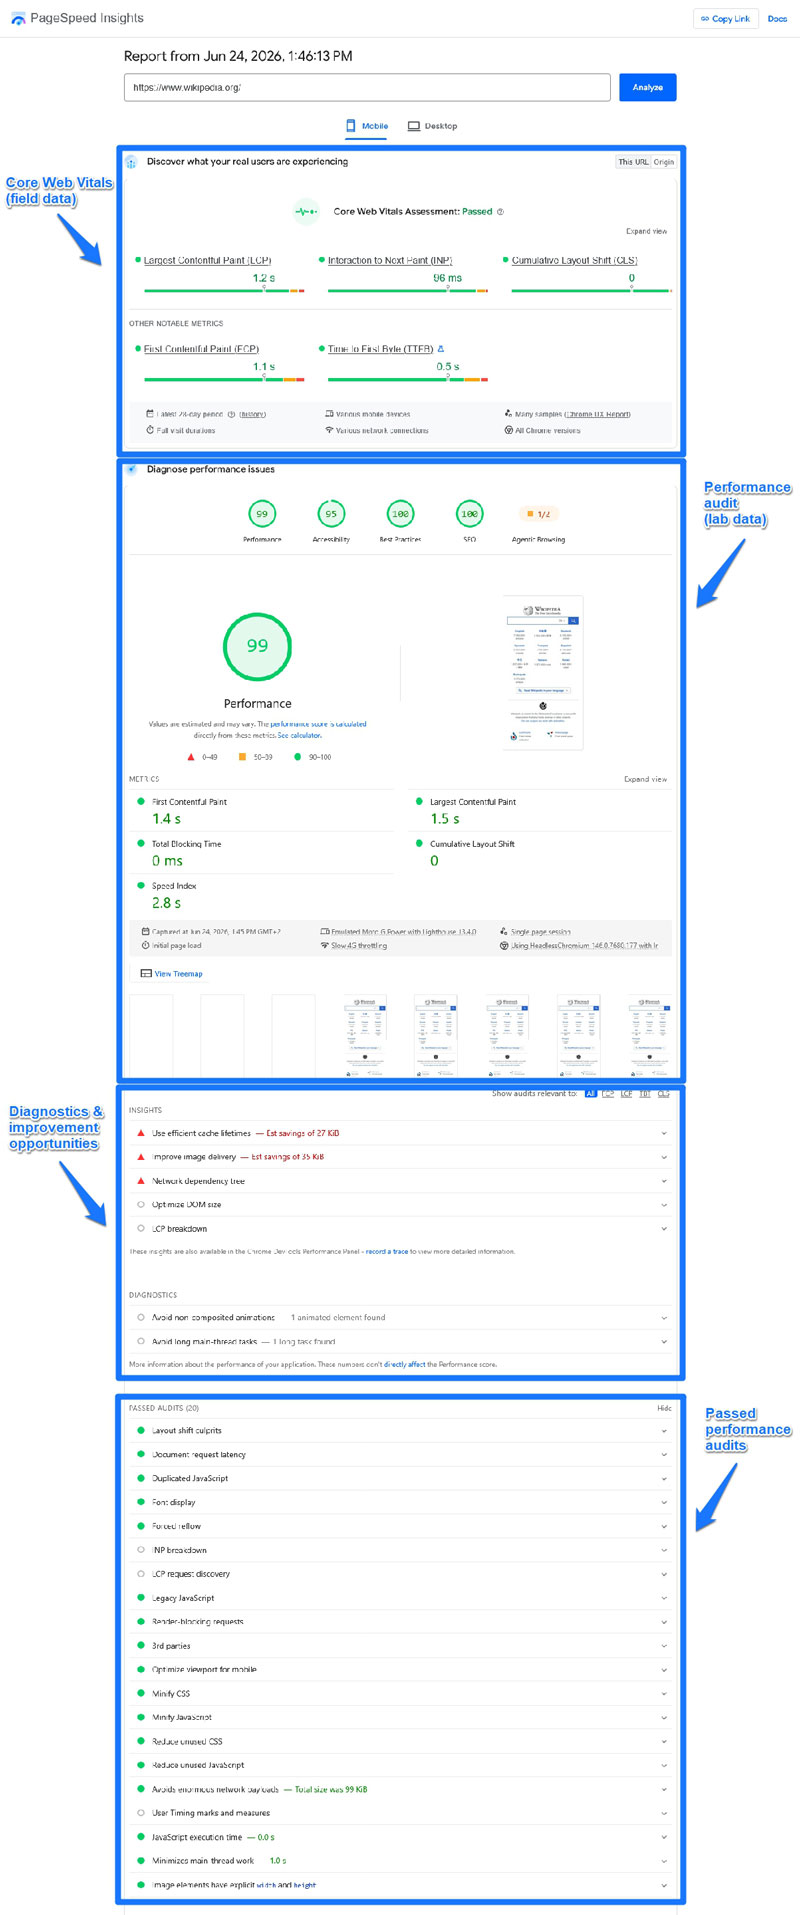
Core Web Vitals Assessment
Core Web Vitals are metrics introduced by Google in 2020 that became a ranking factor in 2021. They measure the user experience on web pages. Currently there are three:
- Largest Contentful Paint (LCP): Tracks how fast your content loads, specifically how long it takes for the main content (e.g. your hero image) to appear.
- Interaction to Next Paint (INP): Indicates how quickly your site reacts to user interactions like clicks or taps. Successor to the First Input Delay (FID) metric.
- Cumulative Layout Shift (CLS): Measures the visual stability of your pages, e.g. whether newly appearing elements push down other elements during the loading process.
You’ll find the Core Web Vitals Assessment section at the top of PageSpeed Insights only if your web page receives enough traffic from Chrome users. The data here is based on the real-life Core Web Vitals experience visitors had on your web page over the last 28 days.
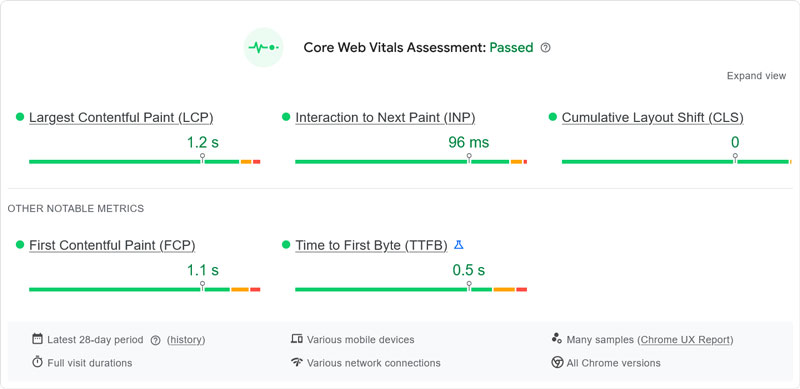
The assessment clearly shows whether you pass or fail, with details for each metric. It also shows First Contentful Paint (FCP) and Time to First Byte (TTFB). They track how long it takes for the first bit of page content to appear and for the server to respond, respectively.
Pay attention to the small This URL/Origin toggle at the top right.
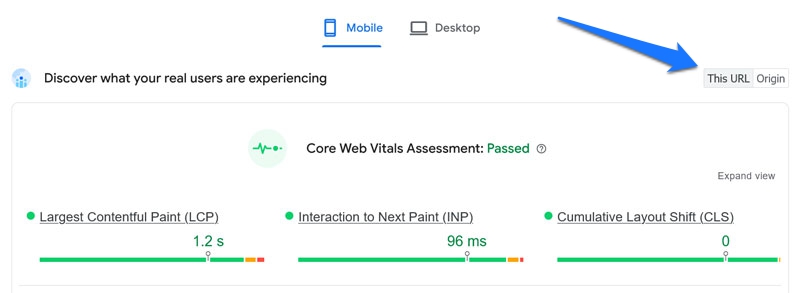
It lets you switch back and forth between the Core Web Vitals assessment of the tested page and the averages for your whole site. This helps you understand, for example, if one page performs significantly worse than the rest.
Performance
The Performance section includes similar information as above.
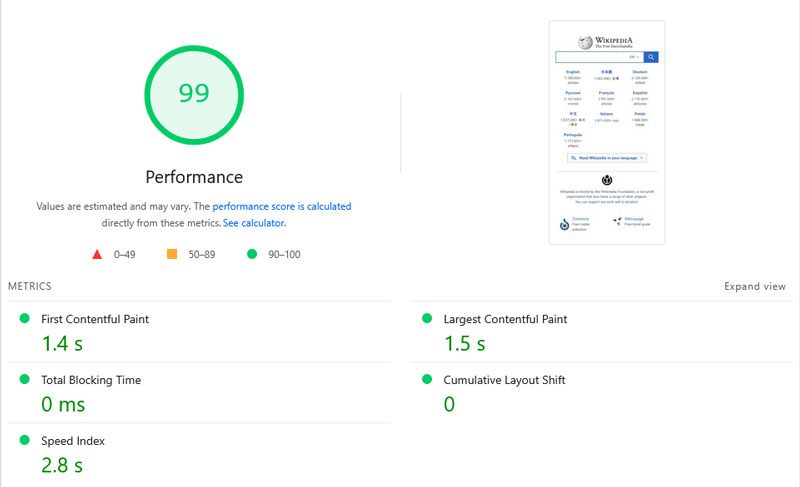
It gives you a breakdown of important performance metrics, including the aforementioned LCP, FCP, and CLS, as well as two additional stats:
- Total Blocking Time (TBT): How long the browser takes to respond to input.
- Speed Index: How quickly the page looks visually complete.
All these metrics feed into the overall performance score at the top. If you want to know the share of each metric, check the Lighthouse scoring calculator.
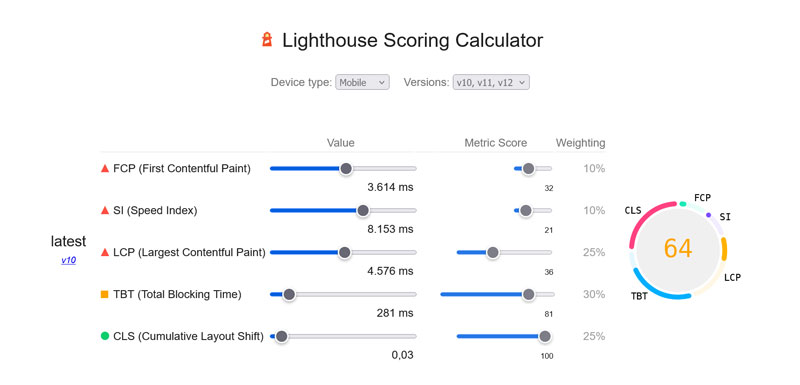
A good score is between 90 and 100, 50–89 needs improvement, and everything below 50 is considered poor.
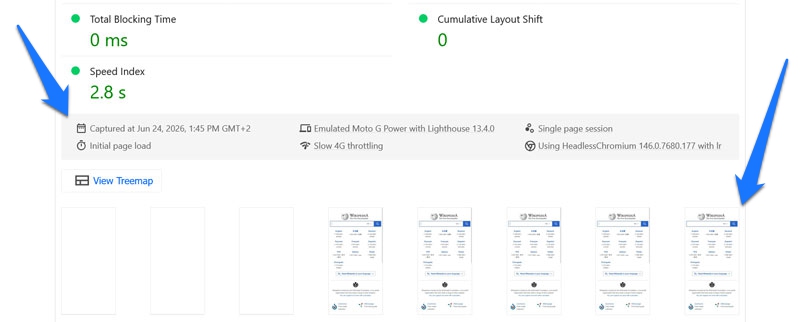
In contrast to the earlier assessment, this is simulated lab data. You can see the specs of the emulated device used in the grey box at the bottom. There’s also a filmstrip showing how elements appear on screen during the loading process.
Insights and Diagnostics
In the Insights and Diagnostics sections, Google PageSpeed Insights lists concrete factors that impede your page performance.
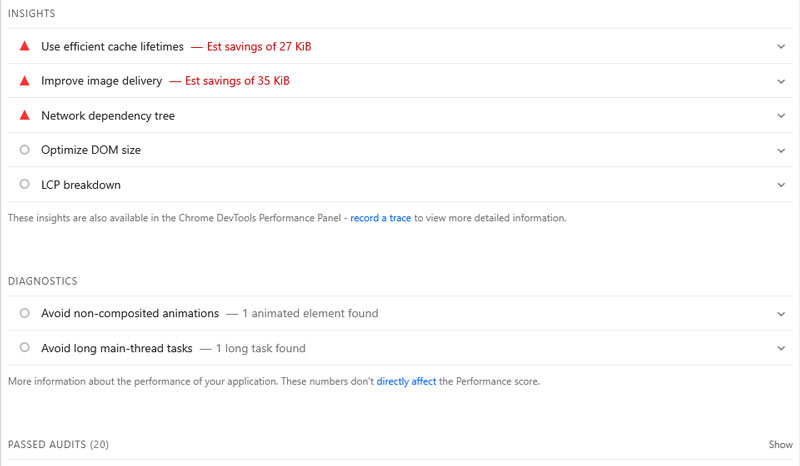
Click on them to see the specific page elements or files causing problems, along with possible solutions and links to resources.
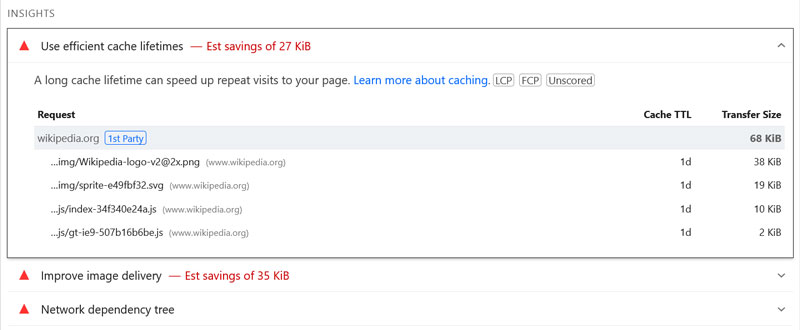
Examples include advice to optimize DOM size, adjust the viewport for mobile, and more.
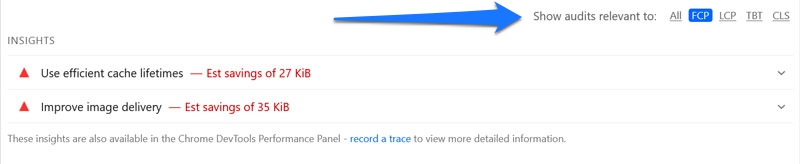
Insights are factors that directly affect your performance score. Diagnostics don’t but can still help you better understand why your page is slow. You can filter them both by which of the main metrics they affect.
Finally, at the bottom there is a list of audits your web page has passed. Click to expand it.
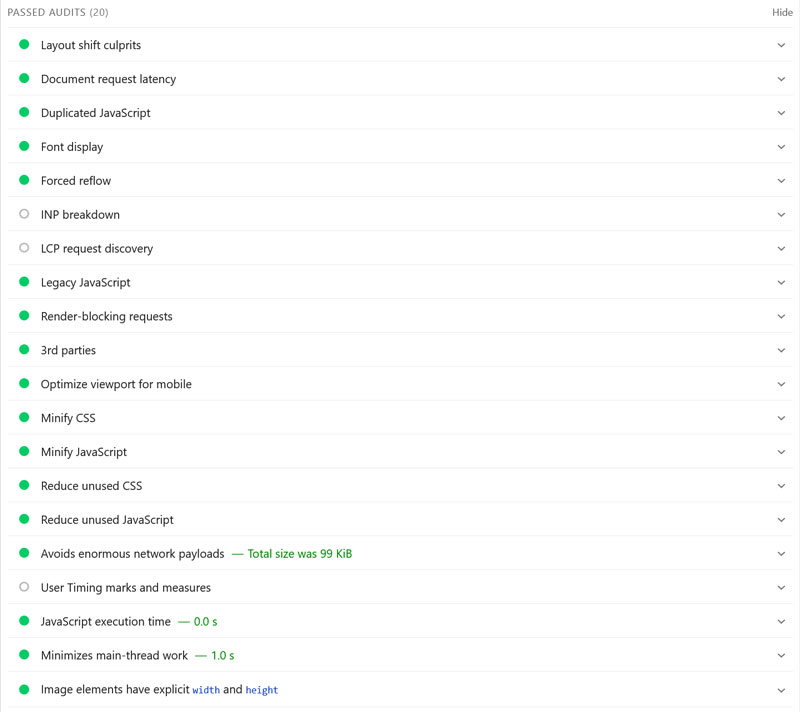
Any insights or issues you successfully address are moved here in your next test.
Accessibility
PageSpeed Insights doesn’t just track markers for page performance but overall user experience. One of those is accessibility, how usable your web page is for people with different kinds of impairments.
The report works similarly to the Performance section: you get an overall score at the top with detailed findings and recommendations below.
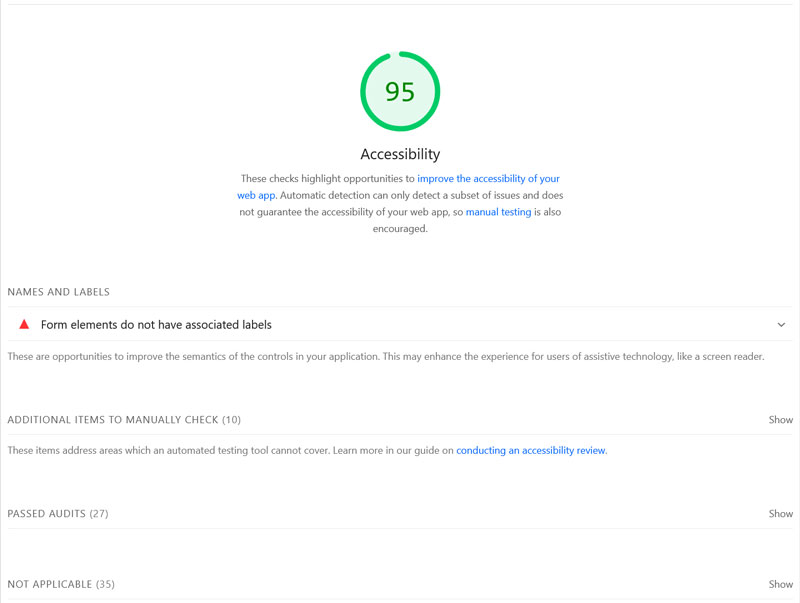
Advice here focuses on things like:
- Usability for screen readers
- Keyboard navigation
- Sufficient contrast
It lists recommended improvements, items to manually check, and passed audits.
Best Practices
This part of the PSI report focuses on security and the technical implementation of your page. It, too, gives you an overall score and additional details below.
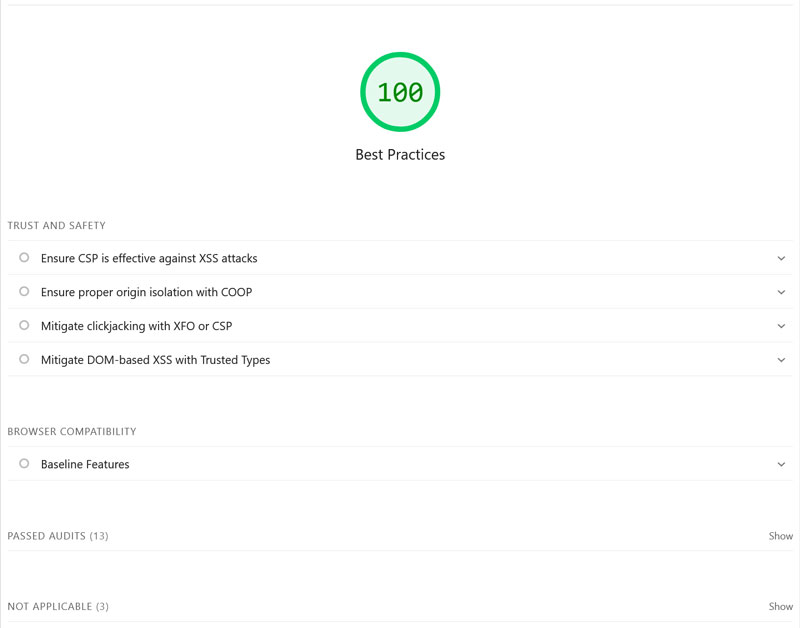
What does it check for? Among others:
- HTTPS encryption
- Cookie usage
- Displaying images in the correct aspect ratio and resolution
SEO
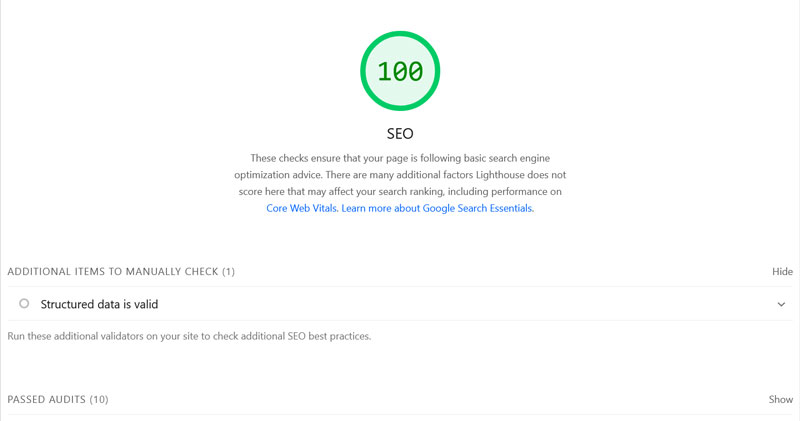
Finally, the SEO report analyzes whether your web page adheres to basic search engine optimization practices, such as:
- Not blocking it from being indexed
- Using a meta description and image alt text
- Having a valid robots.txt file
Agentic Browsing
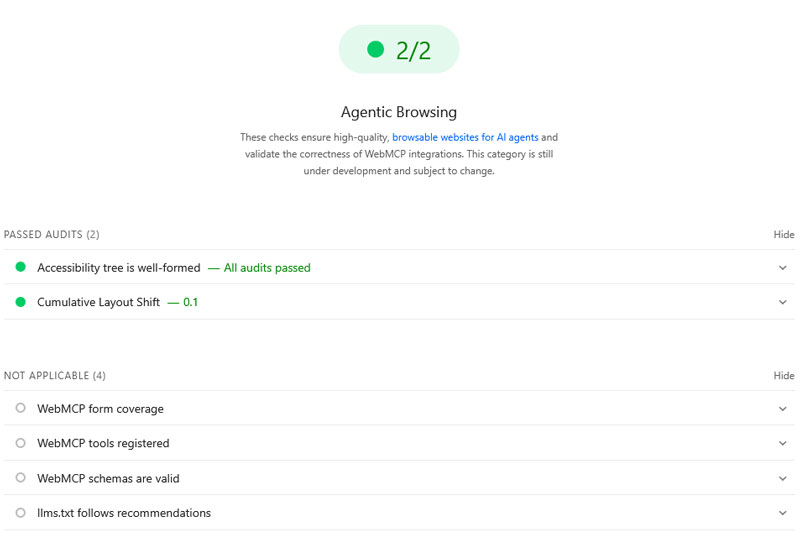
The latest addition to PageSpeed Insights is the Agentic Browsing section. It checks how well the website is configured for the interaction with AI agents.
Because standards for the agentic web are still emerging, the feature is currently experimental. That’s why it also doesn’t give a score from 0 to 100 but instead lists pass/fail scores for the features it looks for
At the moment, these are:
- Accessibility of the site structure
- WebMCP compatibility
- llms.txt configuration
Field Data vs Lab Data — What’s the Difference?
We’ve mentioned PSI using both field and lab data. Here’s what’s behind those terms:
- Field data comes from the Chrome UX Report (CrUX). It’s collected by Google’s Chrome browser while people are using it to surf the web and shows the real-life experience of actual users on your web page.
- Lab data, on the other hand, comes from a simulated visit to your site by a virtual device. It only shows website performance under one specific condition and is great for orientation, but not a reflection of real performance.
The types of data can differ significantly because real-life users introduce far more variables. They come from different locations, use different devices, browser versions, and so on.
Of the two, field data is more important. In the end, you want real people to have a good experience on your web page. So, whenever you can, use field data to measure your progress and lab data to find specific causes behind any issues.
Which PSI Recommendations to Address First
Tackle the information provided by PageSpeed Insights in this order:
- Mobile before desktop: As explained earlier, mobile performance matters more, and desktop markers usually improve alongside it.
- Core Web Vitals and field data: Focus on improving your Core Web Vitals and real-life performance rather than lab data. Keep in mind that the field data window is 28 days, so improvements may take a while to show up.
- Global to page-specific improvements: Prioritize measures that affect your site as a whole (e.g. caching, compression) before moving on to page-specific changes (e.g. page DOM size).
Don’t get hung up on trying to achieve a 100/100 score. Balance performance metrics with actual user experience. If a page feature is flagged that provides real value to users, see if you can improve the way it works rather than eliminating it entirely.
Additionally, take into account what type of website you’re running. Hitting a green score can be much harder for a complex WooCommerce store than a single-page brochure site.
Common WordPress Performance Problems and Fixes
Here, we’ll go over how to use PageSpeed Insights to address typical speed issues experienced by WordPress sites. Generally, the workflow looks like this: workflow looks like this:
- Measure the problem
- Identify the problematic metrics
- Find the biggest cause
- Fix it either by eliminating or optimizing it
- Retest the same URL
- Track performance over time
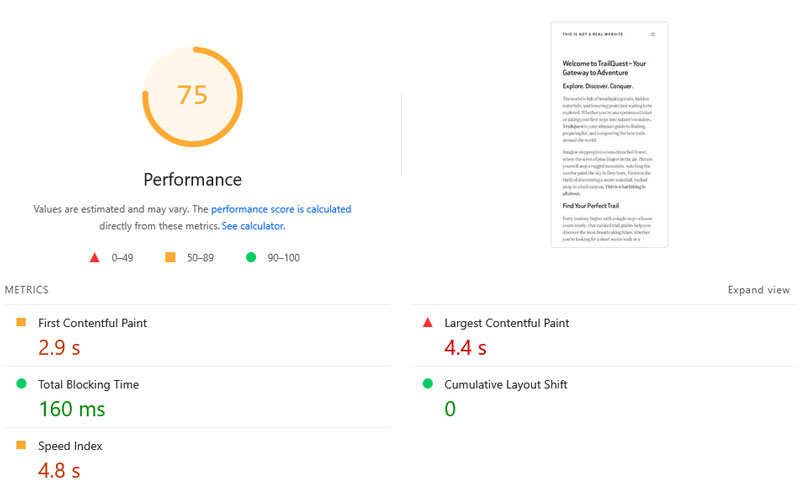
To show you how to apply this to concrete use cases, we’ve set up a test website that will serve as an example. The completely unoptimized site shows the following PSI results.
The Insights and Diagnostics sections also show performance issues frequently present on WordPress websites.
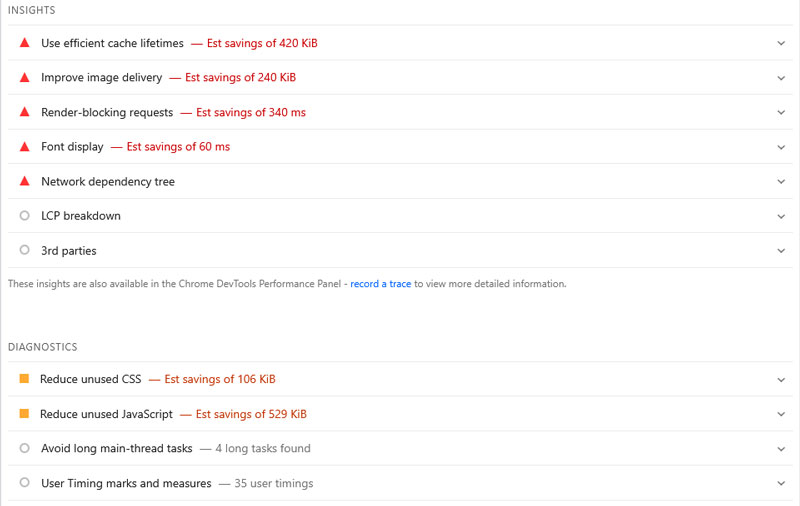
Let’s address them step by step.
1. Document Request Latency
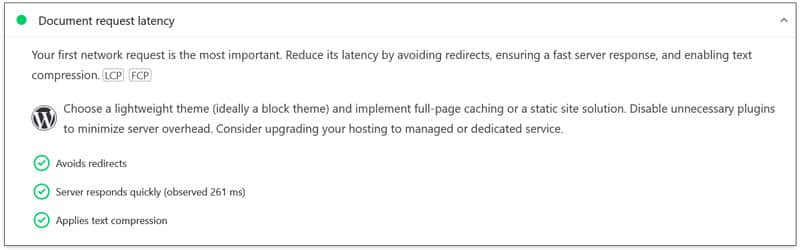
Document request latency is the interval between when a browser initially requests a web page’s HTML document and when the document finishes downloading. It matters because the browser can’t begin to render the page or load other resources before that.
What to do about it:
- Speed up your server
- Use a CDN
- Enable caching, compression, and minification
- Avoid redirects
- Reduce the size and complexity of your HTML document
Frequently caused by:
- Insufficient or slow hosting
- Lack of document and file optimization
- Unnecessary redirects
- Excessive plugins and third-party scripts
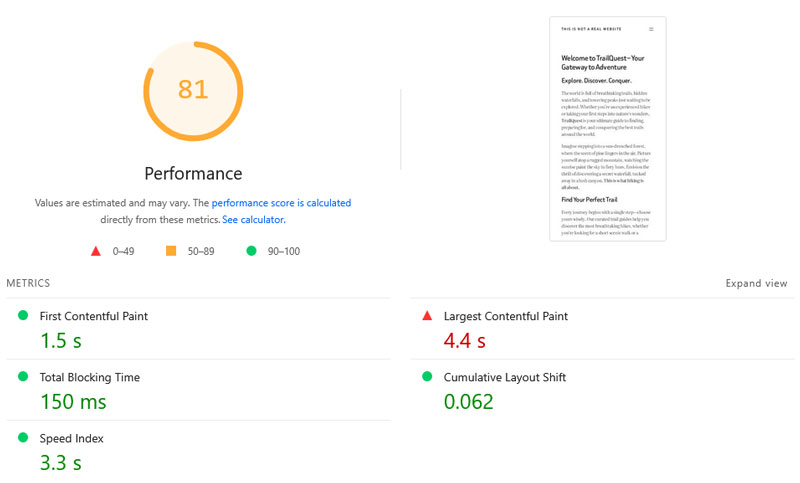
After activating WP Rocket, which implements caching, compression, and minification, (among other automatic and default improvements) PageSpeed Insights shows the improved performance report below.
2. Use Efficient Cache Lifetimes
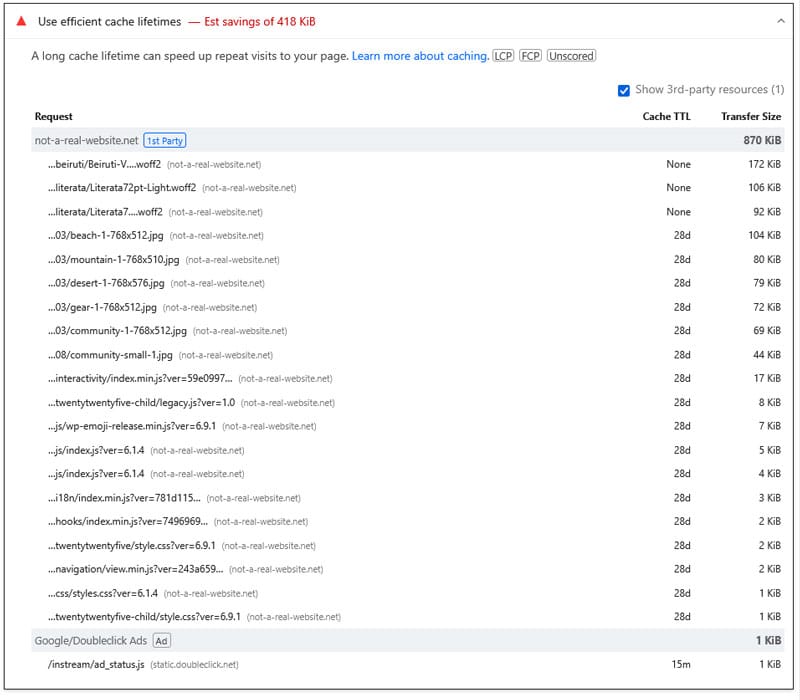
Google’s Use Efficient Cache Lifetimes insight analyzes whether a web page uses browser caching, which is one of several types of caching. Browser caching tells the user’s browser how long to save a website file on the local hard drive for future reuse.
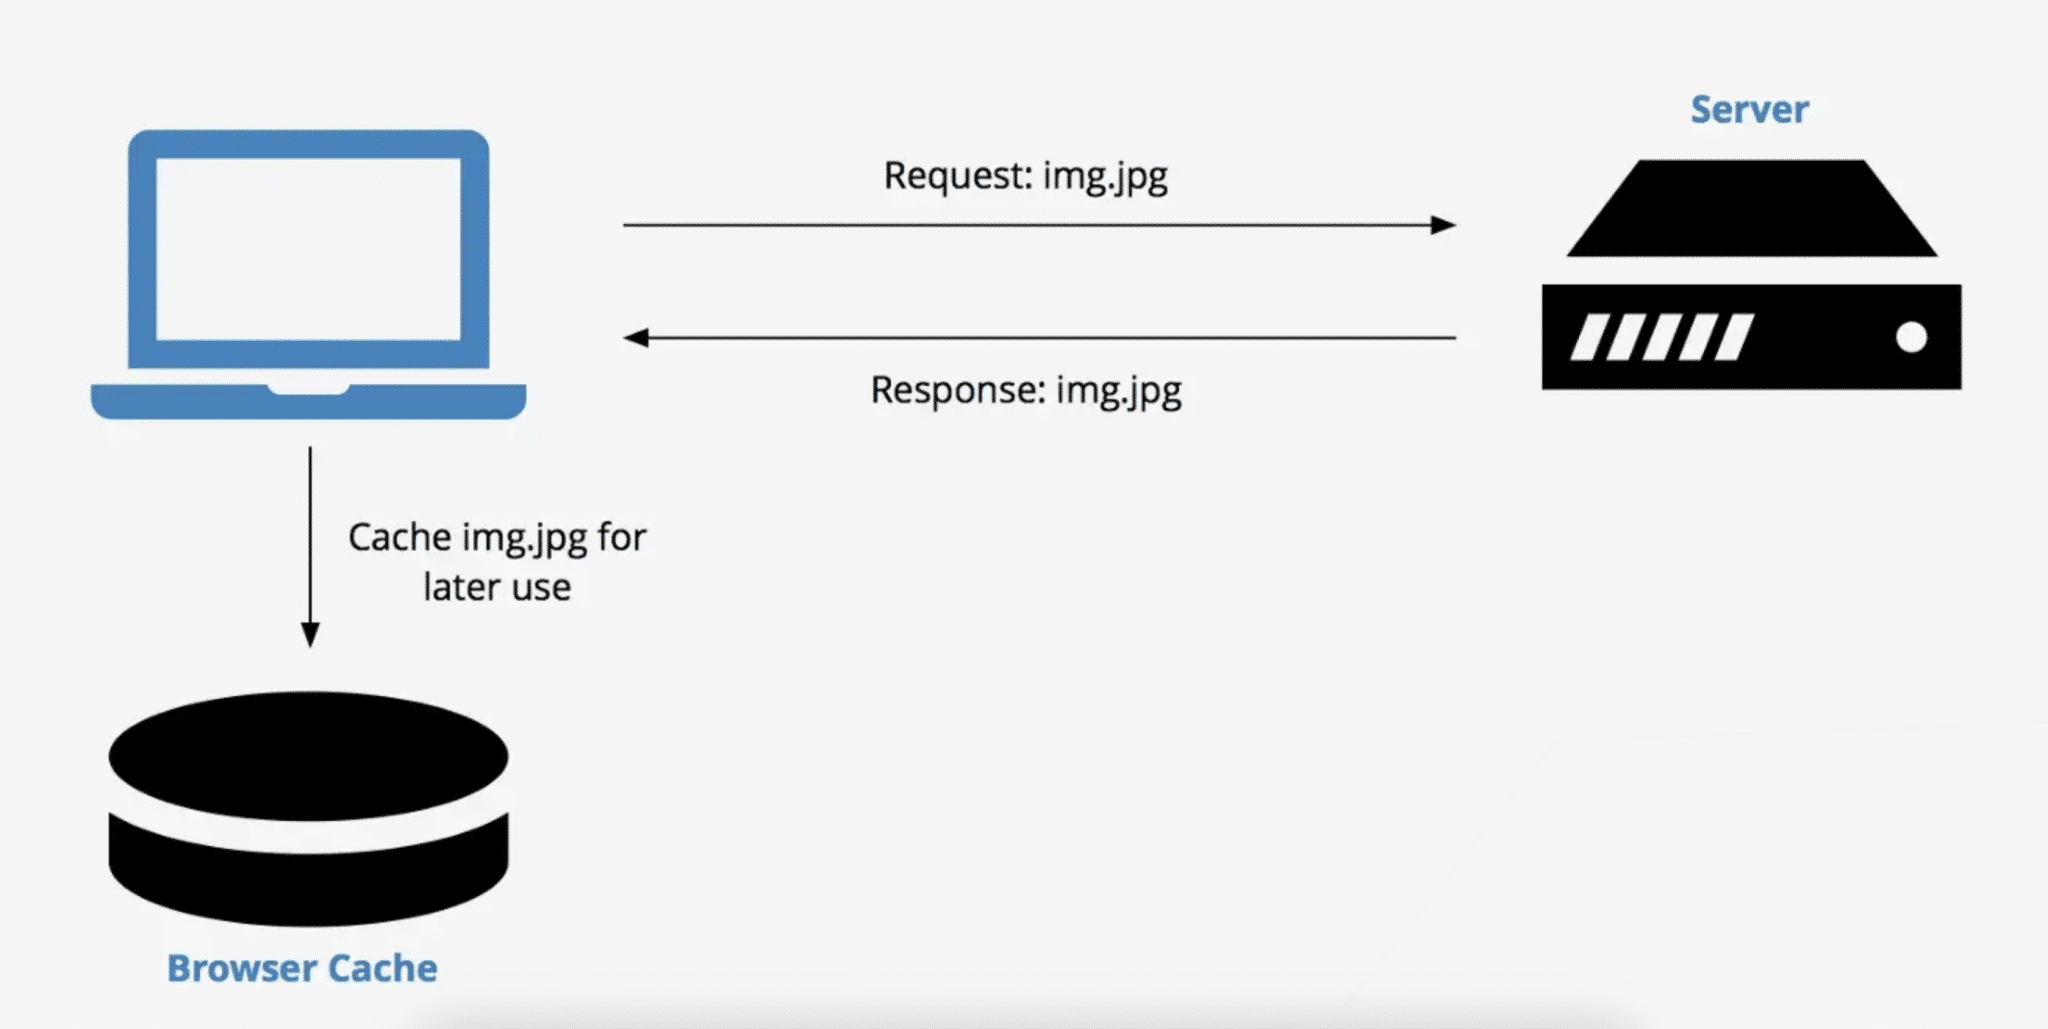
That way, visitors don’t have to redownload every file when they come back to your site, speeding up their loading time.
What to do about it:
- Develop a sensible caching policy for your website
- Implement browser caching
Frequently caused by:
- Unconfigured or unoptimized cache headers
WP Rocket automatically sets up browser caching the moment the plugin becomes active (with a separate mobile cache). It also has additional features to help files load faster, including those not typically covered by caching.
This alone is enough to reduce the uncached assets on the test websites from 420kb to just 50kb.

3. Render-blocking Requests
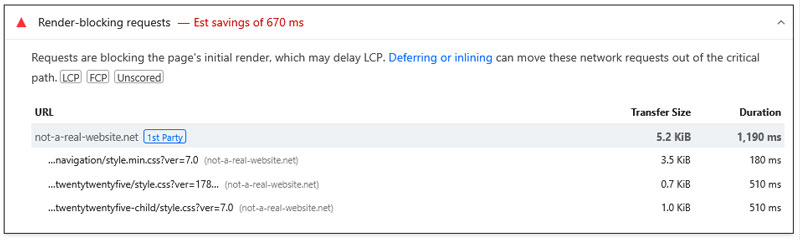
Render-blocking requests are website files (usually JavaScript and CSS) that delay visible content from appearing. They are unnecessary for initial page display, and they keep the browser busy, stopping it from processing more important files.
What to do about it:
- Prioritize code that’s critical for page rendering (e.g. via code splitting and inlining)
- Defer and delay non-essential CSS and JavaScript
- Optimize font file loading
- Enable compression and minification
Frequently caused by:
- Unoptimized themes, plugins, and font files
Besides compression and minification by default, WP Rocket allows you to defer and delay JavaScript as well as remove unused CSS with a few clicks.
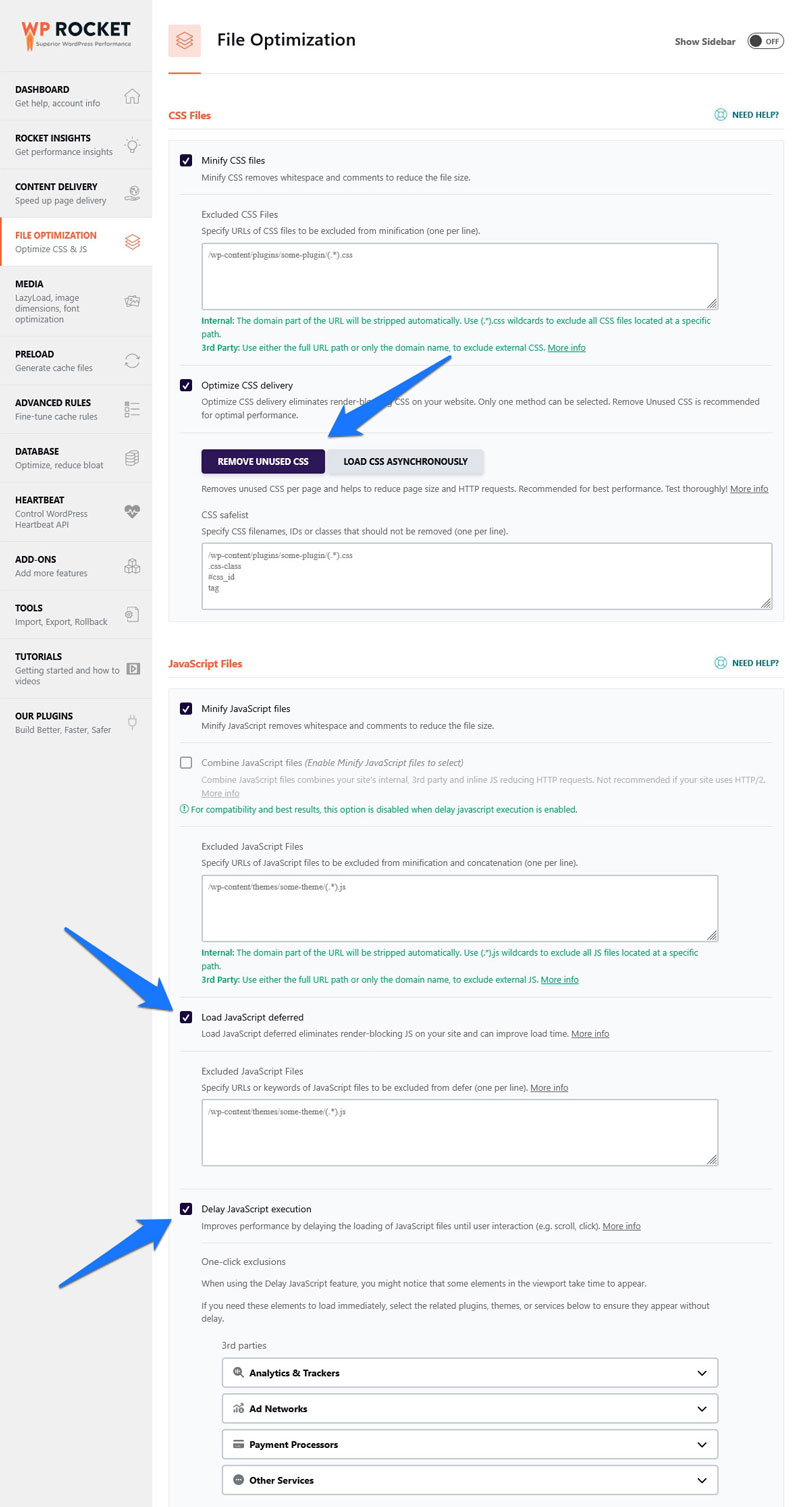
This not only further improves our test websites overall performance score, it also completely resolves the render-blocking requests warning.
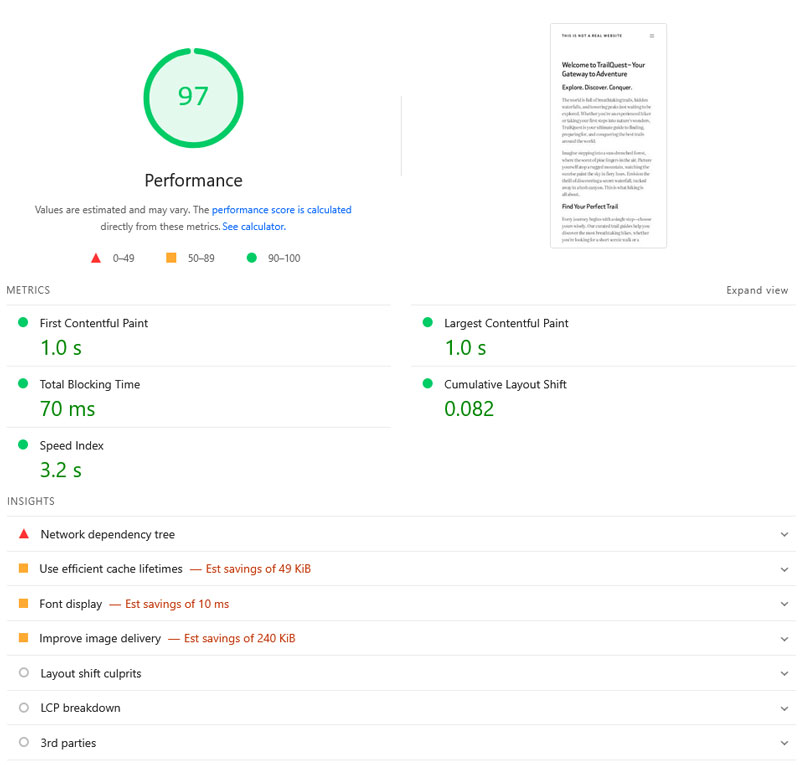
4. Reduce Unused CSS
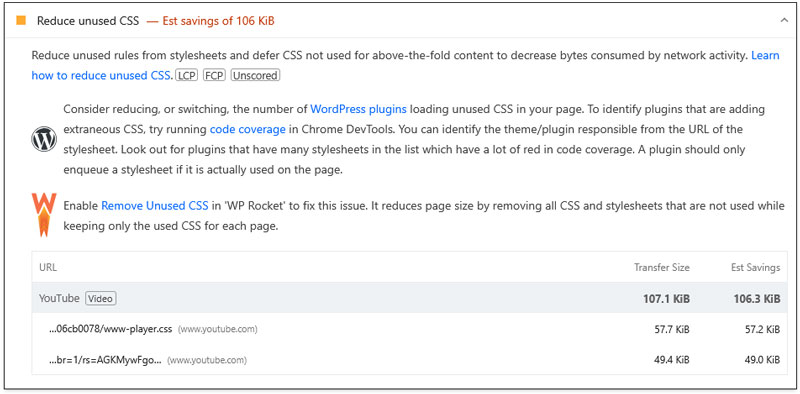
Theme stylesheets usually contain CSS rules for all possible website elements, whether they appear on a particular page or not. Consequently, many web pages load CSS code they don’t need, leading to longer load and rendering times.
What to do about it:
- Audit and remove unused CSS manually or with a tool
- Split CSS across templates so each page only loads what it needs
Frequently caused by:
- Page builders (Elementor, Divi, etc.) loading their full stylesheet globally
- Multiple plugins adding their own stylesheets site-wide
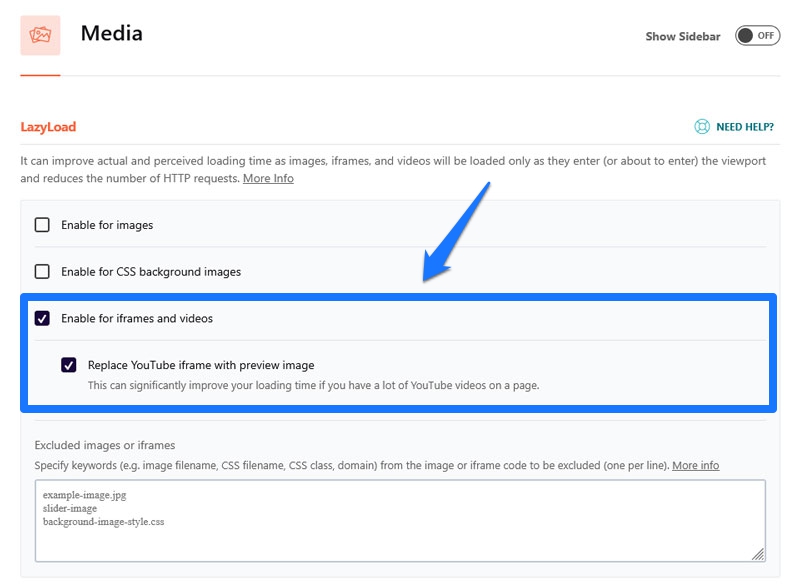
As mentioned, WP Rocket includes removing unused CSS as a one-click option. In the case of our test website, the warning persisted because of an embedded YouTube video on the page, which had its own CSS styles. We were able to solve this by lazy loading the video, which is another one-click option in WP Rocket.
5. Improve Image Delivery
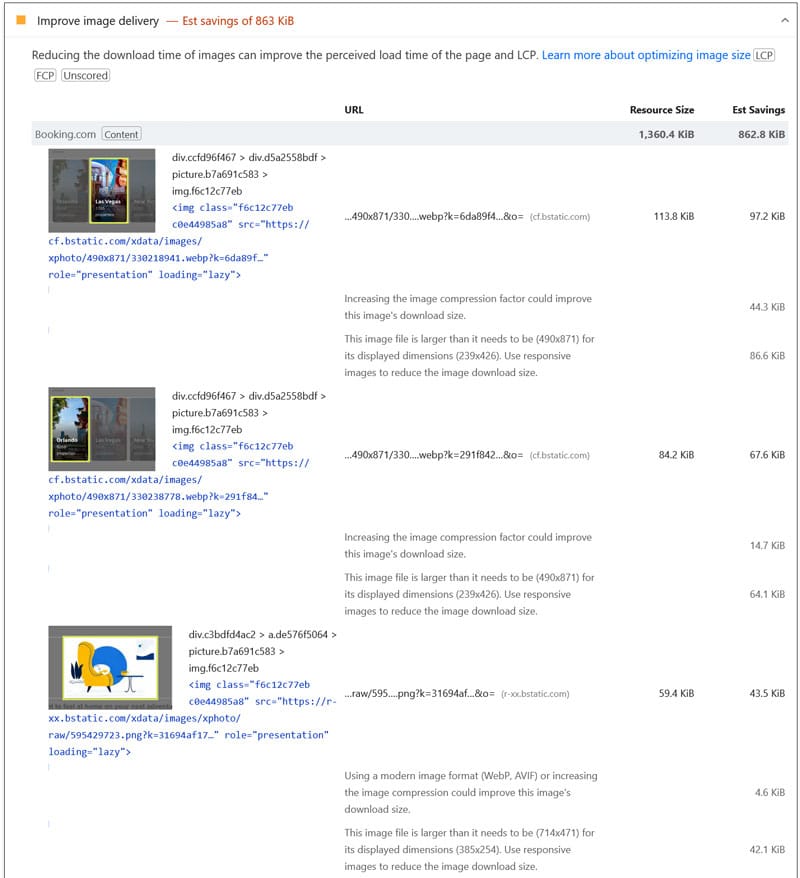
Images are data-heavy, greatly impacting load time, user experience, and SEO. Especially when they appear near the top of a web page, they can negatively impact LCP. Google’s Improve Image Delivery insight highlights images that are too large, poorly compressed, or using outdated formats.
What to do about it:
- Serve images in a size fitting their container
- Use modern formats (e.g. WebP, AVIF)
- Compress images
- Use lazy loading
- Set up a CDN
- Prioritize LCP images
Frequently caused by:
- Unoptimized images
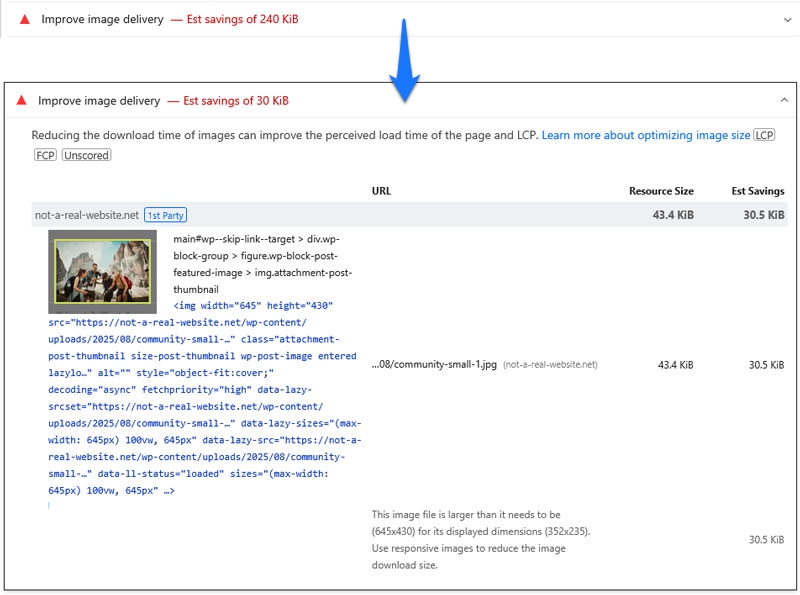
To address this issue, WP Rocket optimizes how images load, e.g. through lazy loading and LCP prioritization. Additionally, Imagify is a plugin you can use to optimize the images themselves. It lets you automatically convert them to the WebP/AVIF format, compress, and resize them.

Together, this was enough to reduce the Improve Image Deliver warning on our test website from 240kb to just 30kb. Further improvements would need manual action.
6. 3rd Parties
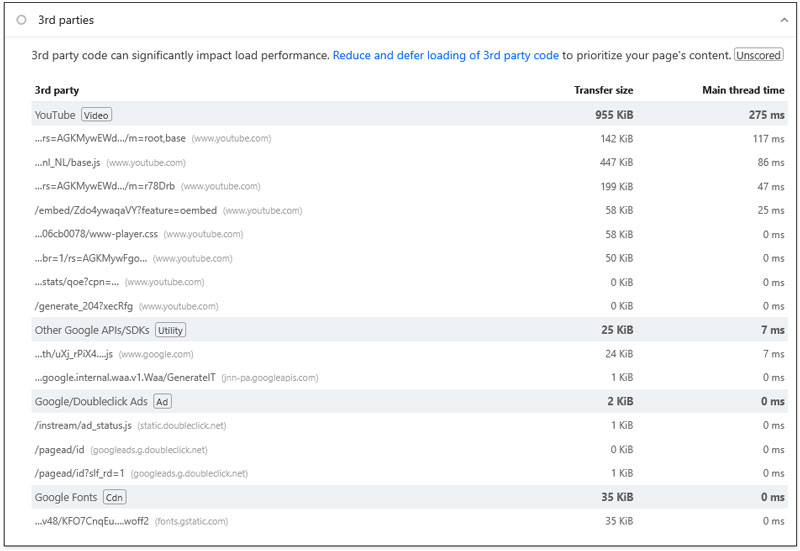
Third-party code (analytics scripts, ads, fonts, embedded videos) can slow down websites by competing with essential files for bandwidth, blocking the main browser thread, and adding HTTP requests. Google’s 3rd Parties insight aims to help you identify which external scripts affect your site’s performance the most, so you can address the problem.
What to do about it:
- Limit third-party code on your site
- Load it conditionally, only where necessary
- Preconnect and prefetch scripts
- Defer and delay less important code
- Self-host external scripts to reduce HTTP requests
- Offload scripts to web workers
Frequently caused by:
- Excessive or poorly optimized third-party content
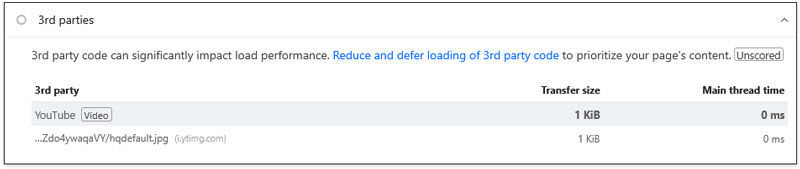
WP Rocket has many features for addressing the 3rd Parties insight. It allows you to preload important files and fonts, defer and delay JavaScript, lazy load visuals and iframes, as well as self-host Google Fonts.
Applying them improved the test website’s 3rd Parties insight greatly compared to the initial readings above.
7. Font Display
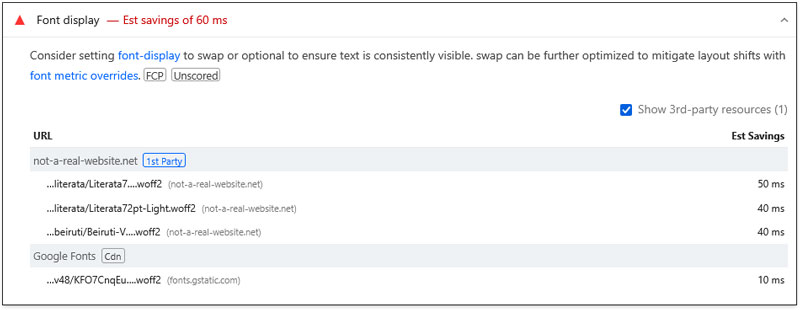
Custom fonts can negatively impact the performance and visual stability of your website, especially when they load delayed. The Font Display insight points out when your page’s font-display CSS property isn’t set to swap or optional.
What to do about it:
- Correctly configure font-display
- Inline, preconnect, preload, self-host fonts
- Use system fonts and modern formats like WOFF2
- Reduce file size through subsetting
- Eliminate CSS that may delay font discovery
Frequently caused by:
- Misconfigured font CSS
- Unoptimized font files
If you use Google Fonts on your site, WP Rocket automatically combines its font requests into one, adds the display=swap parameter, preconnects to Google Fonts, preloads font files, and loads them asynchronously. In our case, everything we’ve already done was enough to move the Font Display insight to the Passed audits section.

8. Layout Shift Culprits
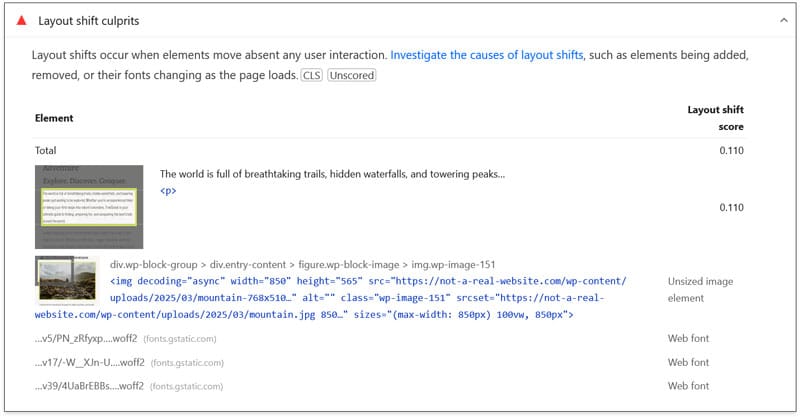
PageSpeed Insights doesn’t only measure page loading speed. The Layout Shift Culprits insight pinpoints which elements cause layout instability and how much each one contributes to your CLS score.
What to do about it:
- Add explicit width and height to images and videos
- Reserve space for ads or embeds
- Connect layout shifts to user interactions
- Optimize font loading and animations
Frequently caused by:
- Missing explicit element dimensions
- Badly optimized web fonts
- Poorly planned and implemented animations
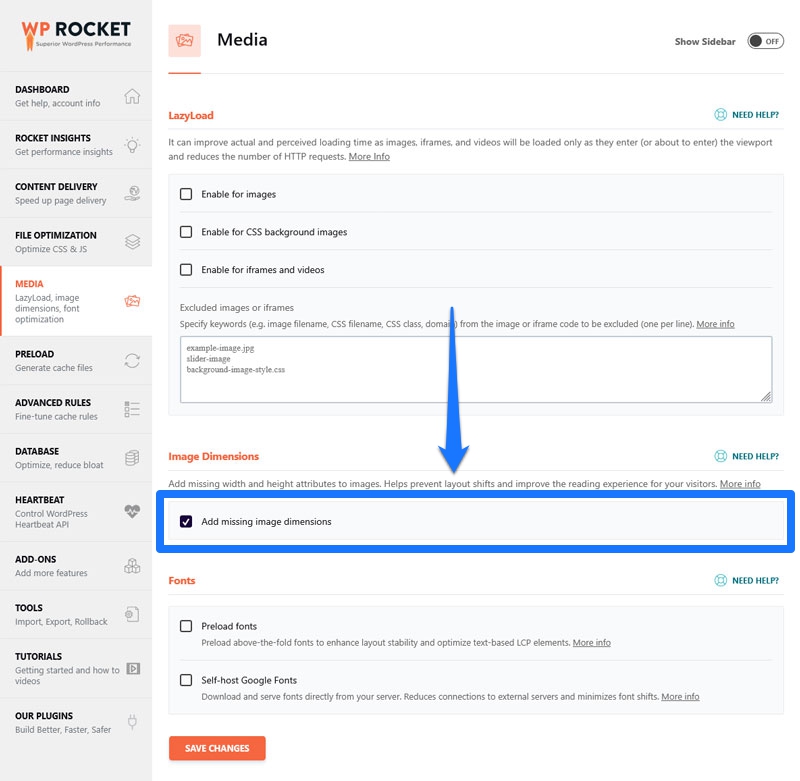
Along with the aforementioned font, image, and code optimizations, WP Rocket allows you to automatically add missing image dimensions with one click.
Before/After Comparison
As you’ve seen above, taking targeted action on common performance issues can greatly improve your WordPress site’s PageSpeed Insights report. For comparison, here are the performance results from our test website after implementing everything mentioned above.
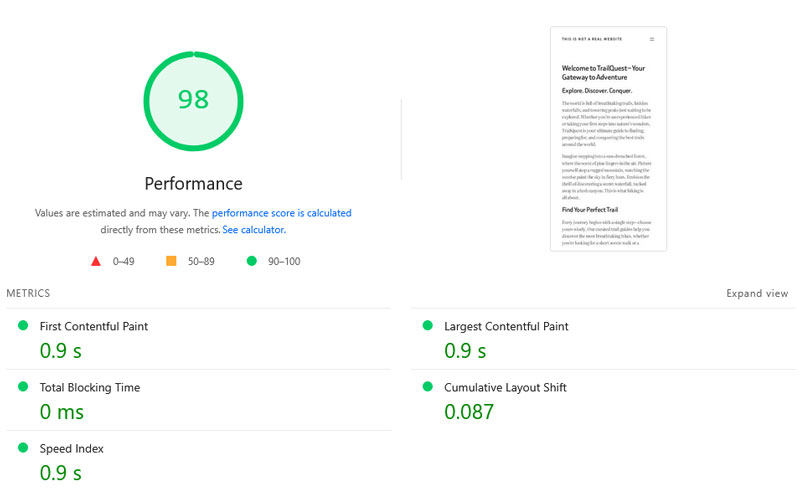
Here are the most important metrics side by side:
| Value | Before | After |
| Mobile Performance score | 75 | 98 |
| First Contentful Paint | 2.9s | 0.9s |
| Largest Contentful Paint | 4.4s | 0.9s |
| Speed Index | 4.8s | 0.9s |
Most importantly: Using WP Rocket, it only took a few minutes and a handful of clicks.
When to Use GTmetrix, Lighthouse, and Search Console
PageSpeed Insights is not the only way to web page performance.
GTmetrix is a freemium performance testing tool. Like PSI, it’s powered by Lighthouse and delivers the same key metrics, including Core Web Vitals, field, and lab data.
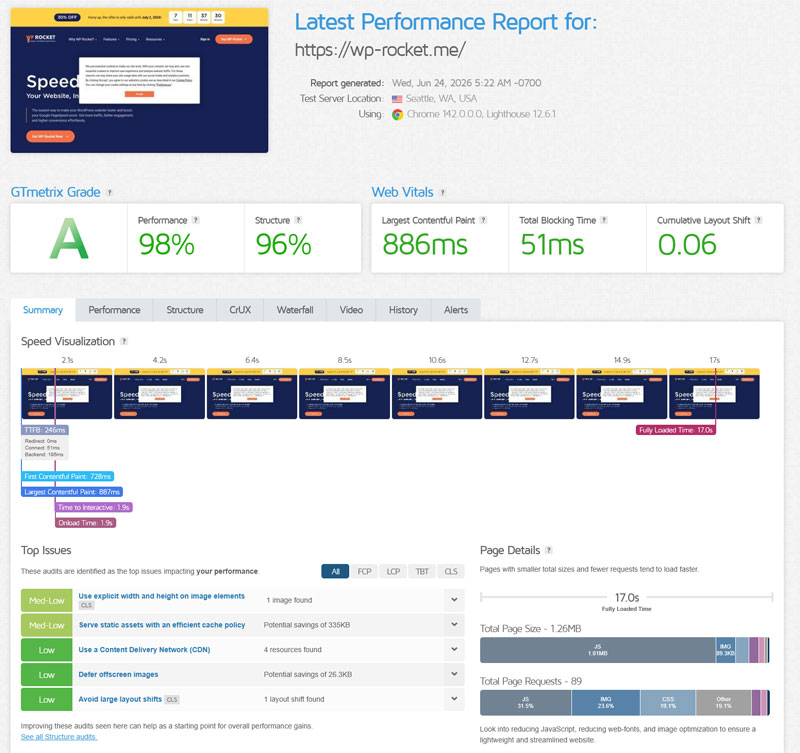
The tool gives you concrete improvement tips ordered by urgency and a waterfall diagram to pinpoint bottlenecks in your page’s loading process. You can compare several reports side by side, and the Pro plan adds features like automated testing, different test locations, and more.
GTmetrix also powers Rocket Insights, the performance monitoring tool inside WP Rocket.
Use it if you want more detailed diagnostics than PageSpeed Insights provides, the ability to compare results, and track improvements over time rather than just a momentary snapshot.
Lighthouse is the open-source tool that’s behind both PageSpeed Insights and GTmetrix. It’s accessible in Chrome developer tools (via the Performance report) and as a standalone tool that can run via the command line or as a Node module.
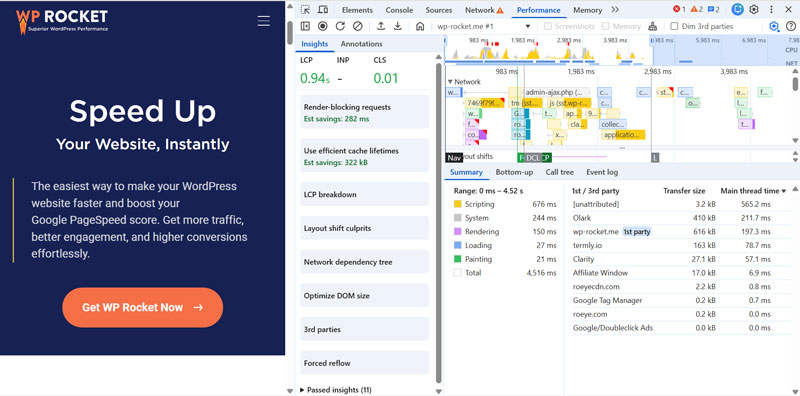
In Chrome, it delivers real-time information while using your website. Besides that, Lighthouse has all the same insights as PSI but adds additional tools. For example, it provides a detailed frame-by-frame breakdown of the loading process and highlights individual files and resources connected with failed insights. This makes it easy to spot problems like long JavaScript tasks, render-blocking resources, or uncached files.
It’s perfect if you’ve already applied most major performance improvements and want to dive into the nitty-gritty of individual pages and resources.
For a quick overview, you can also use the Core Web Vitals report in Google’s webmaster tool Search Console. It only shows field data, so your site needs sufficient traffic to use it.
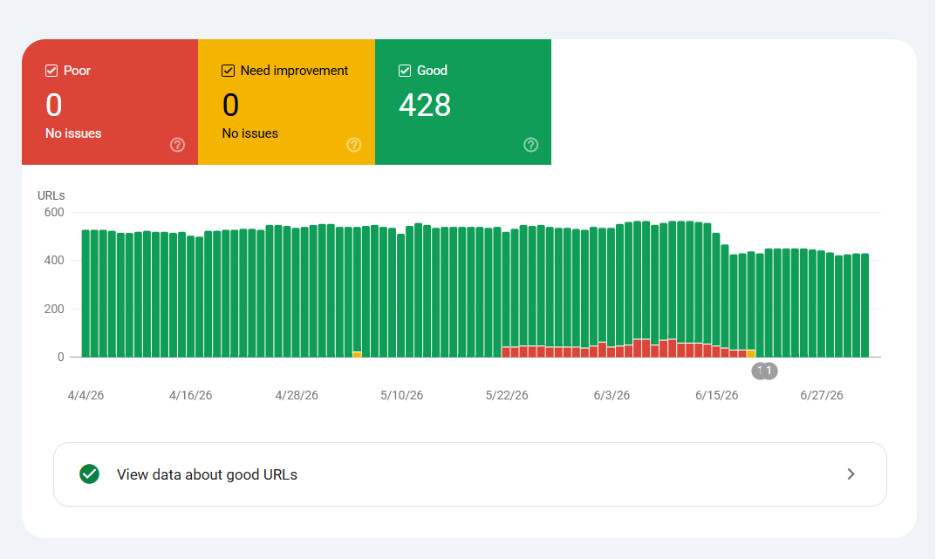
Search Console examines only pages indexed in Google, and groups them by page type rather than individual URL. It’s not designed to check the status of a single page.
What it does well is help you understand your site’s Core Web Vitals performance overall and identify issues that affect groups of pages across your site.
| PageSpeed Insights | GTmetrix | Lighthouse | Search Console | |
| Cost | Free | Freemium | Free | Free |
| Field data | ✅ | ✅ | ✅ (needs activation) | ✅ |
| Lab data | ✅ | ✅ | ✅ | ❌ |
| Core Web Vitals | ✅ | ✅ | ✅ | ✅ |
| Compare reports | ❌ | ✅ | ❌ | ❌ |
| Tracking over time | ❌ | ✅ | ❌ | ✅ |
| Depth of diagnostics | Medium | High | Very high | Low |
| Best for | Quick audits | Detailed diagnostics and tracking | Deep per-page debugging | Site-wide CWV overview |
FAQ
Finally, here are some frequently asked questions about PageSpeed Insights.
What is Google PageSpeed Insights?
A free Google tool that scores your page speed and user experience, as well as tells you how to improve them.
Why are my PageSpeed Insights lab and field data different?
Lab data simulates one device. Field data reflects real visitors across varying devices, locations, and connections.
Is PageSpeed Insights the same as Lighthouse?
No. PSI is powered by Lighthouse but runs in the cloud. Lighthouse runs locally and shows deeper diagnostics.
Do I need a 100/100 PageSpeed score?
No, you don’t. First and foremost, aim for green Core Web Vitals and fixing real-life user experience.
Which PageSpeed Insights recommendations should WordPress sites fix first?
Start with Core Web Vitals on mobile. Then tackle site-wide issues like caching, render-blocking files, and image problems before going page-specific.
Why are my mobile and desktop scores on PageSpeed Insights different?
Mobile scores are usually lower due to slower devices and network throttling that simulates real-world conditions.
Build a Better Website with Google PageSpeed Insights
PSI is one of the most useful free performance testing tools. It tells you exactly where your site is falling short, what’s causing it, and how to fix it.
The key is to not get lost chasing numbers. Focus on your Core Web Vitals, prioritize mobile performance, and work from site-wide improvements down to page-specific ones.
Want to improve PageSpeed Insights on your WordPress site without touching a line of code? WP Rocket handles the heavy lifting for you, with powerful default settings and one-click improvements. Test it risk free with our 14-day money-back guarantee!