
How to Improve the Lighthouse Performance Score and Metrics on WordPress
Table of Contents
Whenever Google makes changes to how they plan to rank websites, everyone has to pay attention – and we’re at that point right now. Google has made its intentions clear to roll out the Core Web Vitals as part of a new ranking factor, and it’s something that you need to be on top of if you want your WordPress site to stay relevant.
That’s why, in this article, we’re going to delve into what all of this means and how you can use Google Lighthouse to optimize your site’s performance.
What is Google Lighthouse?
Google Lighthouse is a free, open-source tool that measures the performance of your website and provides a range of metrics and insights to help you improve the overall user experience. The tool itself is simple to use and, in just a few seconds, will present you with a report on all the relevant Core Web Vitals information as well as some actionable items to improve several site’s aspects such as SEO and web accessibility – so you can assess exactly how your site is performing.
This performance score is calculated by weighting the various performance metrics and offers a comprehensive look at how your website is performing. If you want to understand more about how the score is calculated, there is a very useful calculator available here.
It’s very important that you run a Lighthouse audit on your WordPress site because it can bring to light certain performance weaknesses with your site that negatively impact the user experience and give you the insights you need to turn those around optimize things.
Unpacking the Lighthouse Report and Metrics
The Lighthouse metrics are split into five different categories, namely: Performance, Accessibility, Best Practices, SEO and Progressive Web App (PWA). All of them serve at improving the overall quality of web pages.
1. Performance Audit
- The First Contentful Paint (FCP) marks the first point when a user can see anything on the screen, and it is considered the perceived load speed as a result.⚖️ This metric has a 10% weighting towards your Performance score.✅ The best sites out there are performing at 1.5 seconds, but as long as your FCP is under 2 seconds, you’re still considered to be in the ‘fast’ bucket which is where you need to be.
- The Speed Index (SI) shows how quickly the contents of a web page are visibly populated.⚖️ This metric also holds a 10% weighting when calculating the performance score.✅ Ideally, you’re looking for a speed index time that is under 4.3 seconds – which correlates to a speed index score of 75 and above.
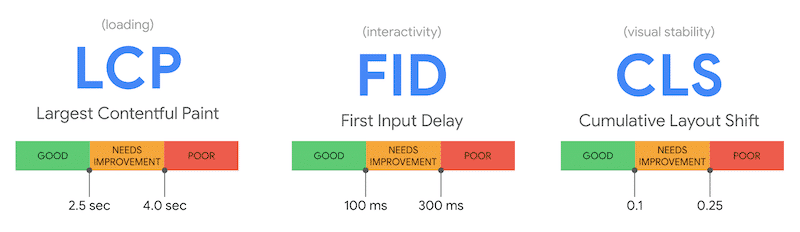
- The Largest Contentful Paint (LCP) is a metric that measures how long it takes the largest visible element on the site to be rendered.⚖️ This particular metric is weighted at 25% making it one of the most important elements to get right in order to optimize the performance score.✅ A good score in this department is around 2.5 seconds or less as this makes for the best user experience.
- The Total Blocking Time (TBT) quantifies your page’s load responsiveness to user input. It can be used to replace your FID (First Input Delay) score in the lab data. They measure different things (user input vs user interaction) but by improving TBT you usually also improve FID, which is a Core Web Vitals.⚖️ This is another crucial component of the performance score carrying a weighting of 30%.✅ A good TBT time is considered to be anything less than 300 milliseconds.
- The Cumulative Layout Shift (CLS) measures how visually stable a page is by quantifying how often users might experience unexpected shifts to the layout.⚖️ This metric is weighted 25% in the overall performance score.✅ A good CLS score is considered to be 0.1 or less which approximates the optimal user experience.
Please note that Time to Interactive has been removed in Lighthouse 10, and it’s no longer included as a Lighthouse performance metric.
2. Accessibility Audit
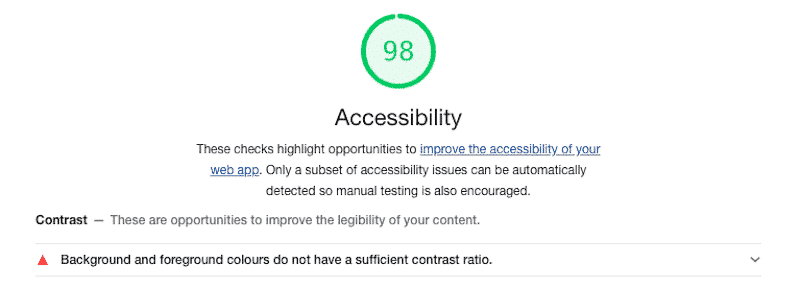
The accessibility score relates to how usable your website is for all users, in all their diversity. Ideally, your site should perform just as well for those who have visual, motor, hearing, or cognitive impairments as it does for those who are fortunate enough to be free of those concerns.
✅ You should be aiming here for as close as you can get to a perfect 100. The most common way to improve this is to ensure that your text has high contrast, so it is easy to read. Your site should be effectively navigated with just a keyboard, and your images should have the relevant alt texts included for those who can’t see them.
The thinking here is aligned with the tenets of the Web Content Accessibility Guidelines (WCAG) 2.0 which lays out the various best practices we should all be working towards.
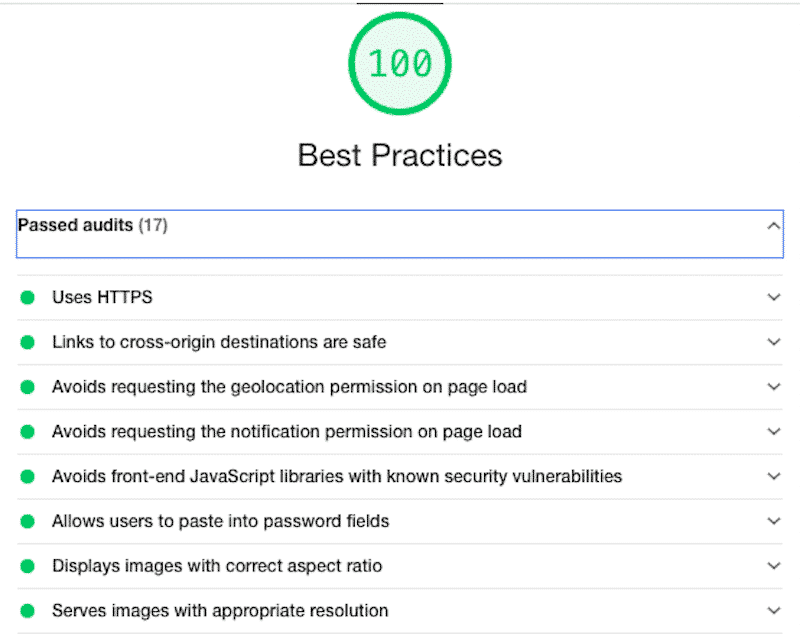
3. Best Practices Audit
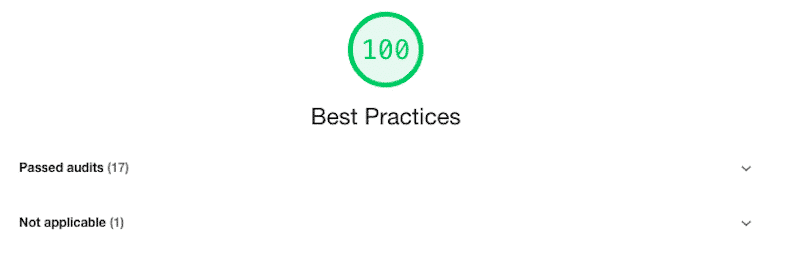
This section runs a number of audits on your website to look for best practice web development components that make for a great user experience.
✅ These are the low-hanging fruit that you should definitely be taking care of, so if you aren’t at 100 here, look at the audits that didn’t pass and implement those changes to optimize this particular metric.
The passed audits have a green point next to them, and each section is expandable. If you click on them, you’ll find an in-depth explanation of each audit.
4. SEO Audit
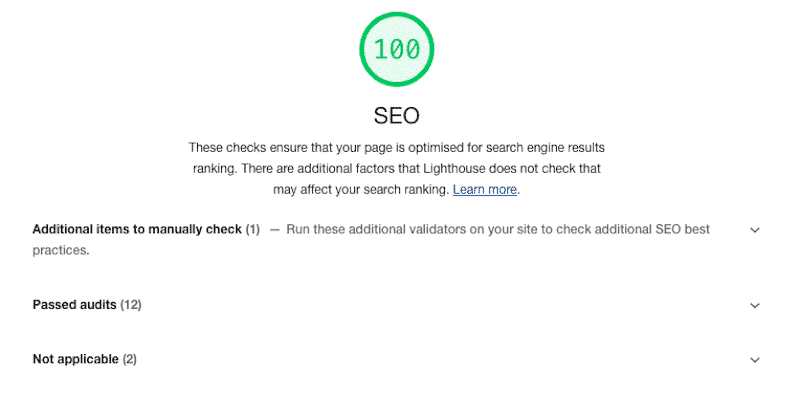
The second-to-last section of the Lighthouse metrics is the SEO section which analyzes your site to ensure that it is optimized for search engine ranking. This is not looking at your specific keywords, of course, but just making sure that the overall structure of your page is set up well for ranking purposes.
Here it will look for automatically generated content, link schemes, cloaking, sneaky redirects, hidden text, doorway pages, scraped content, and the like – so don’t think you can get away with any of that. You really should be authentic and above board in this department.
5. Progressive Web App (PWA) Audit
The last section is the PWA. These checks validate the aspects of a Progressive Web App. A PWA is a built and enhanced API that delivers better capabilities, reliability, and stability for everyone wherever you are in the world. As an example, Uber has been rebuilt from scratch following the PWA’s principles.
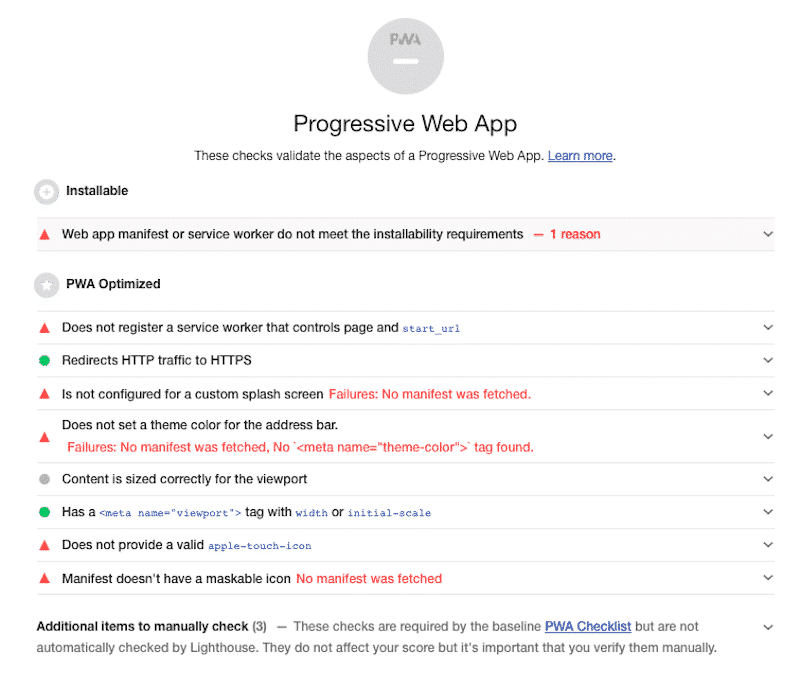
And that makes up the Lighthouse 6.0 measurement system!
Now, let’s look at exactly how we test for performance.
How to Test Speed and Performance Using Lighthouse
There are four different tools you can use to run a Lighthouse audit on your site. They all use the same metrics explained above as well as the same KPIs.
- Web.Dev: an intuitive tool that runs the full audit (Performance, Accessibility, SEO, and Best Practices) but does not take into consideration the device you are doing the analysis for.
- Gooogle Chrome Developer Tools: the most complete tool which analyses all the KPIs mentioned above (plus PWA) both on mobile devices and desktop.
- Google PageSpeed Insights (PSI): the most popular tool which only measures the Performance KPI of your website.
- GTmetrix: a popular performance tool that also measures the Lighthouse Performance metrics.
1. Web.Dev
The first tool is a browser-based tool called Web.Dev where you simply enter the URL of your site, click ‘Run Audit’ and it will do its thing.
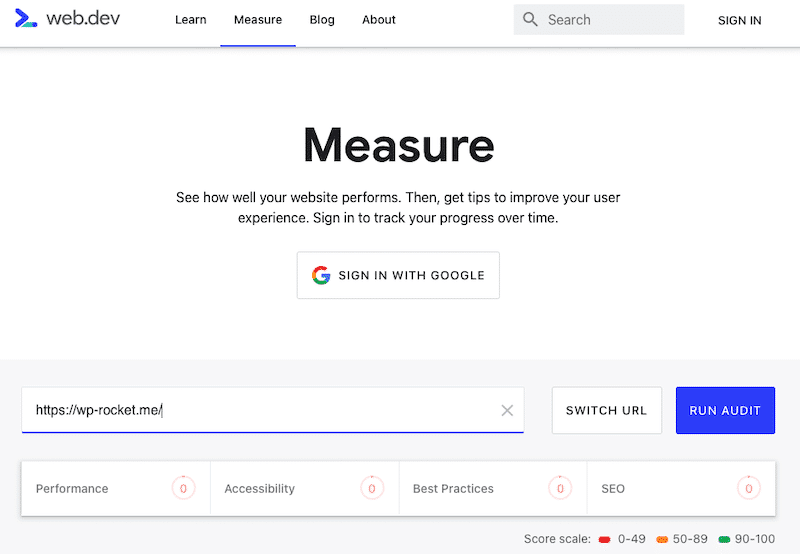
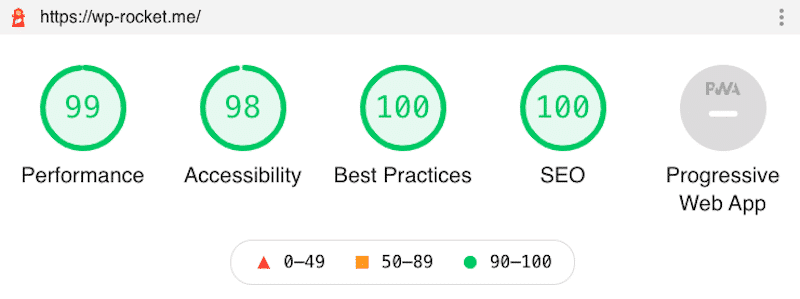
Once the audit has been completed, it will show you a report that looks something like this:
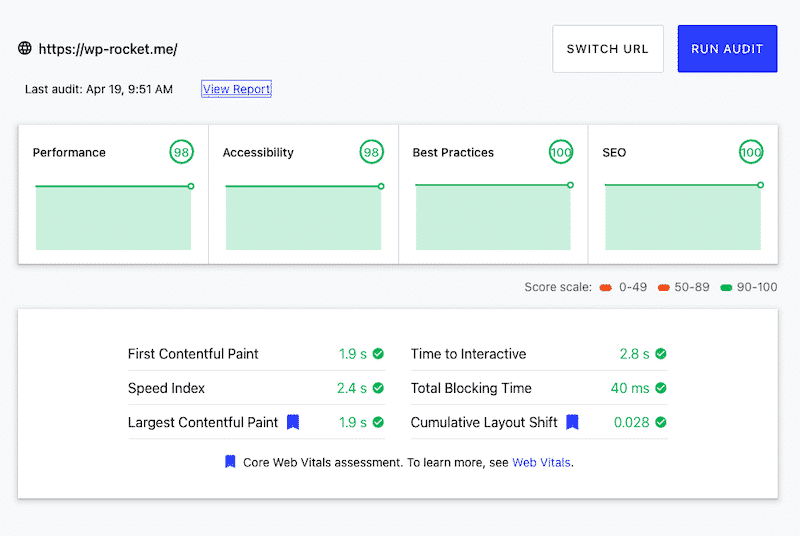
Be sure to click on the ‘View Report’ button to dive deeper into each metric and get the insights that you need.
Web.dev does not deliver two different reports for mobile or desktop, you only get one analytics report.
2. Google Chrome Developer Tools
The second way you could do it would be in the developer tools of the Chrome browser itself. To run an audit in Chrome, follow these steps:
- Open Google Chrome in incognito mode.
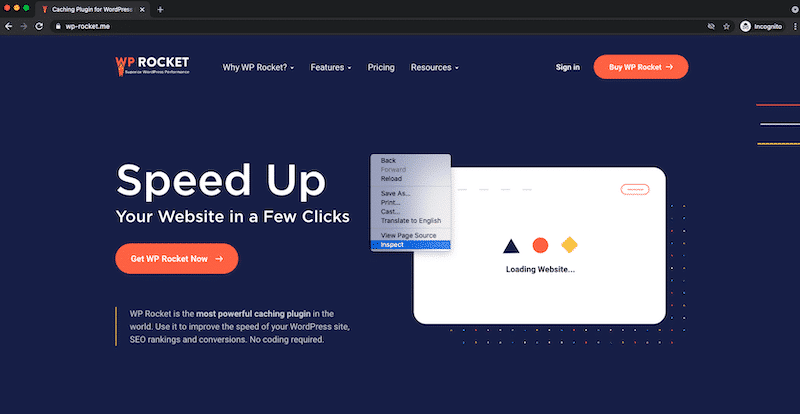
- Navigate to the website you wish to run the audit on. Let’s take a look at wp-rocket.me.
- Right Click anywhere on the page and then click ‘Inspect’.
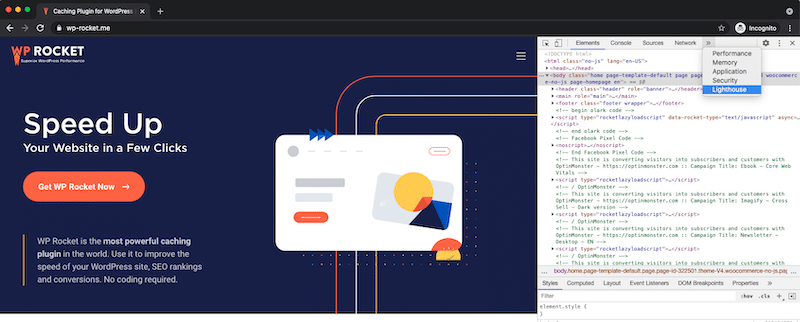
- You’ll then need to look for the tab called ‘Lighthouse’ which might be hidden behind the arrows at the top of the developer tools section.
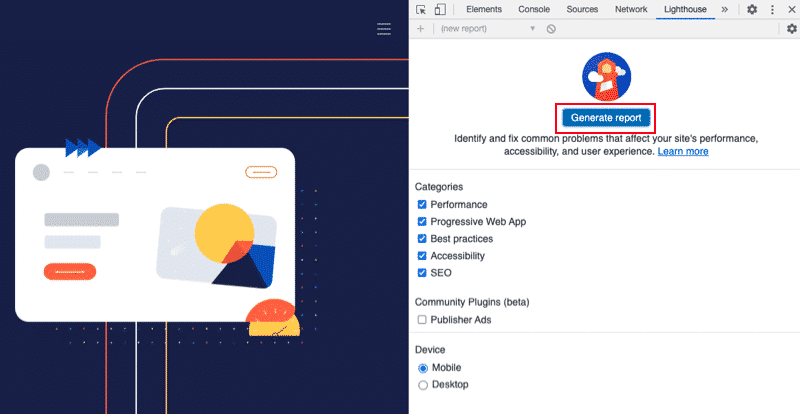
- Once you’re there, click ‘Generate Report’ to get the full Lighthouse audit.
🖋️ Hint: you can also download the Chrome Extension called “Lighthouse,” but Google says that “unless you have a specific reason, you should use the Chrome DevTools workflow rather than this Chrome Extension workflow. The DevTools workflow allows for testing local sites and authenticated pages, while the extension does not.”
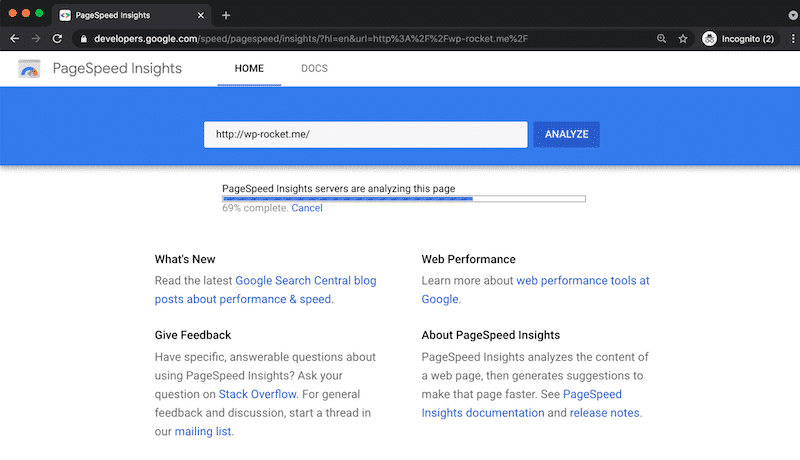
3. Google PageSpeed Insights (PSI)
Google PageSpeed Insights is the most used tool amongst our clients to measure performance. The tool is pretty straightforward. All you need to do is enter any URL and have it analyzed in a few seconds.
| ⚠️ Important: PSI is able to deliver only a performance report of your website. It does not evaluate the “SEO, Accessibility and Best Practices” metrics contrary to Web.dev and to the Google Chrome Developer Tools. |
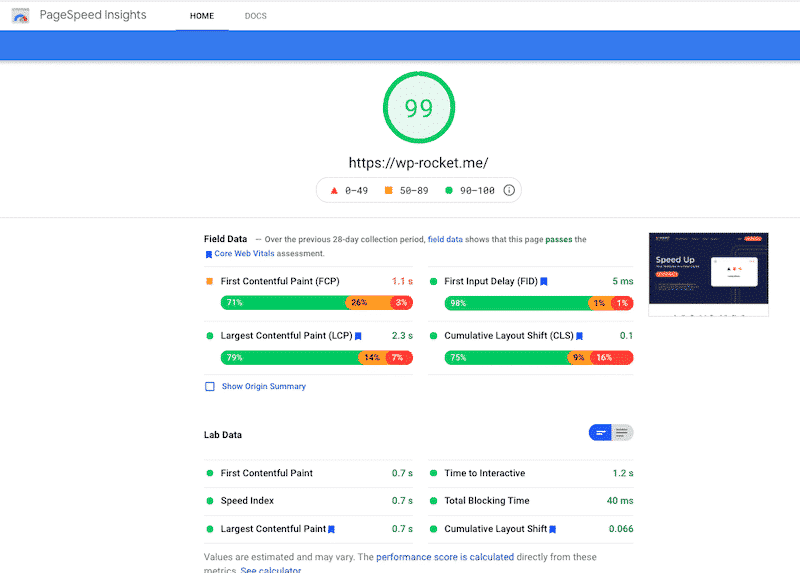
The report contains six main sections. Let’s go over them and see how the Lighthouse metrics are organized.
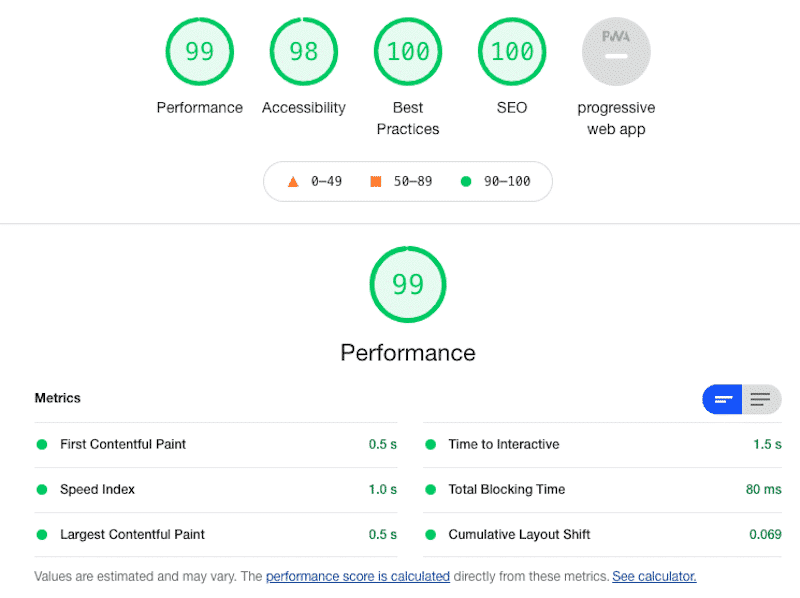
- The global score: which is the general performance grade of your website. It can be red (0-49), orange (50-89), or green (90-100)
- The “Field Data”: based on real-life users
- The “Lab Data”: an artificial set of data.
👪 Field vs 🧪Lab data defined by Google:
“The field data is a historical report about how a particular URL has performed, and represents anonymized performance data from users in the real-world on a variety of devices and network conditions. The lab data is based on a simulated load of a page on a single device and fixed set of network conditions”.
The first data presented by Lighthouse includes the Core Web Vitals and three other metrics.
- The Core Web Vitals:
Here are the four other metrics also measured by Lighthouse:
- The Speed Index (SI)
- Time to Interactive (TTI)
- Total Blocking Time (TBT)
- First Contentful Paint (FCP).
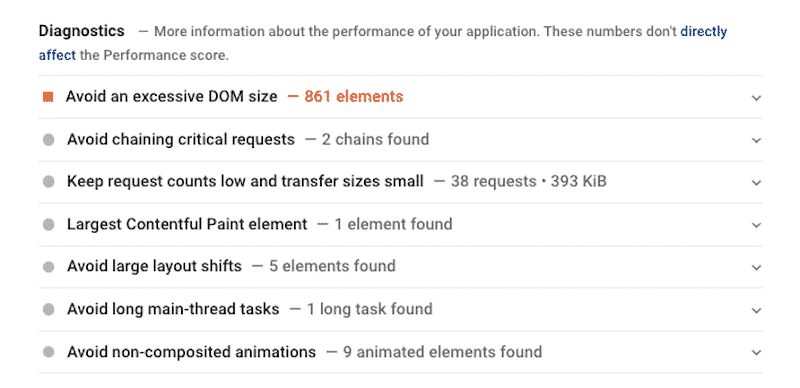
The “Diagnostics” section tells you what to improve.
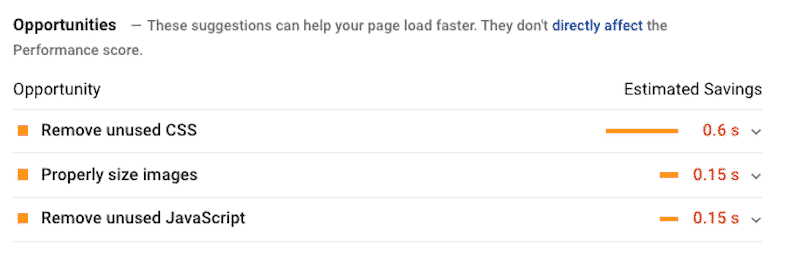
The “Opportunities” section gives you some suggestions on how to make your website loading faster.
The “Passed audits” section: It’s always reassuring to see some green color when running an audit. This part basically tells you what you have been doing right.
4. GTmetrix
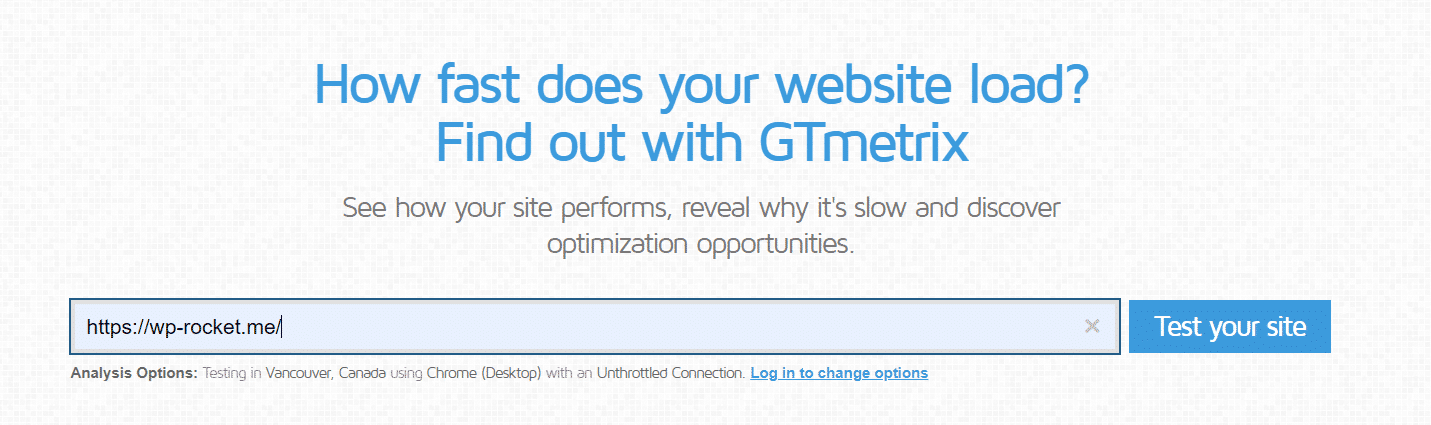
GTmetrix is another popular performance tool that analyzes your site’s performance and measures the Performance Lighthouse metrics. You can test your site from different locations. By default, the tool will perform the test from the desktop. You only have to include your URL and click ‘Test your site’.
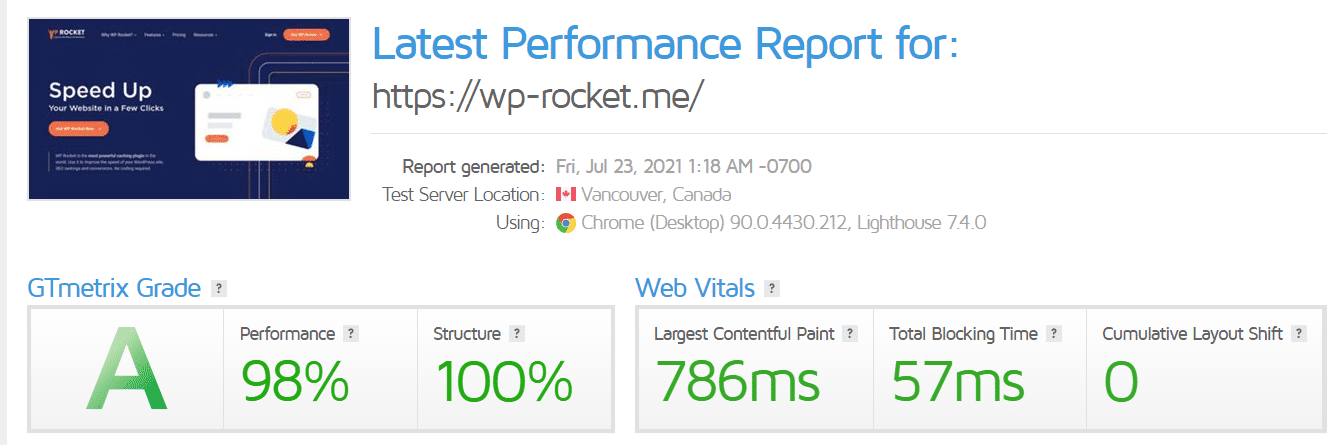
Once the audit is done, you’ll get a Performance grade and you’ll know how the Core Web Vitals are performing:
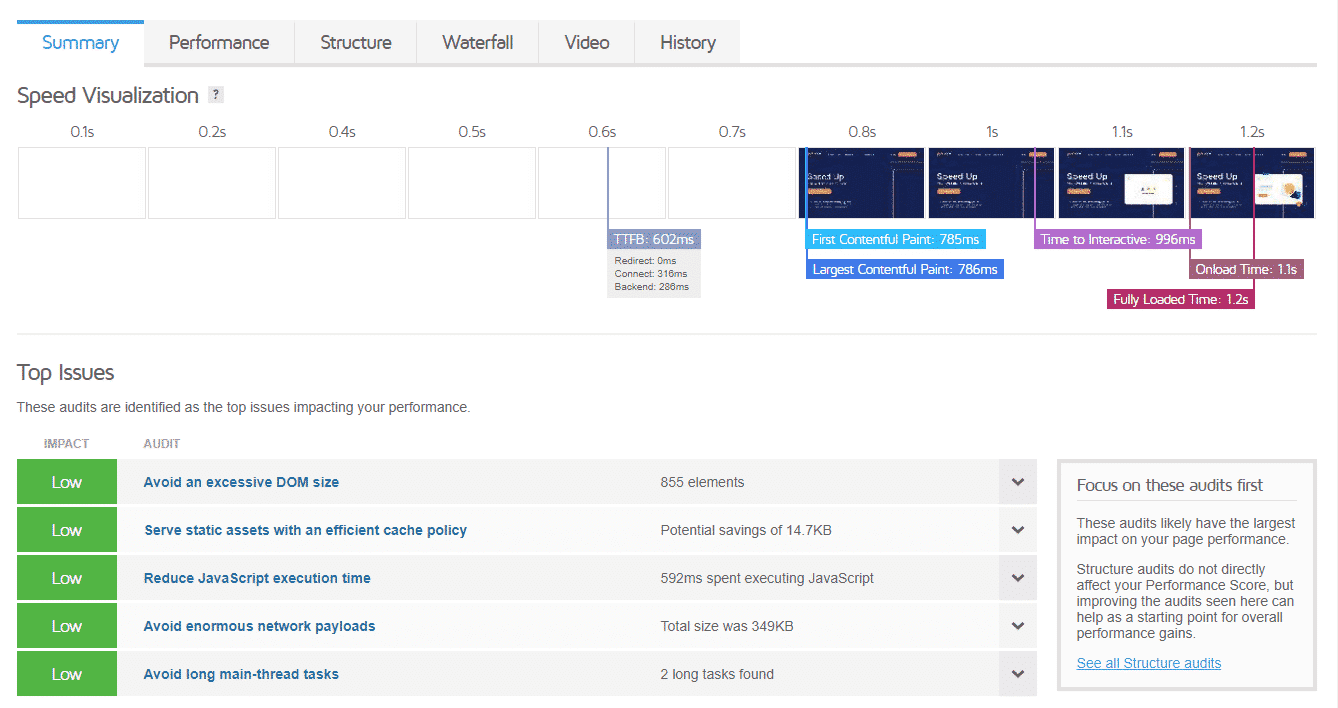
What’s more, the tool provides you with several tabs, starting from the Summary. It will be straightforward to see how long it takes for the page to load and what are the top issues.
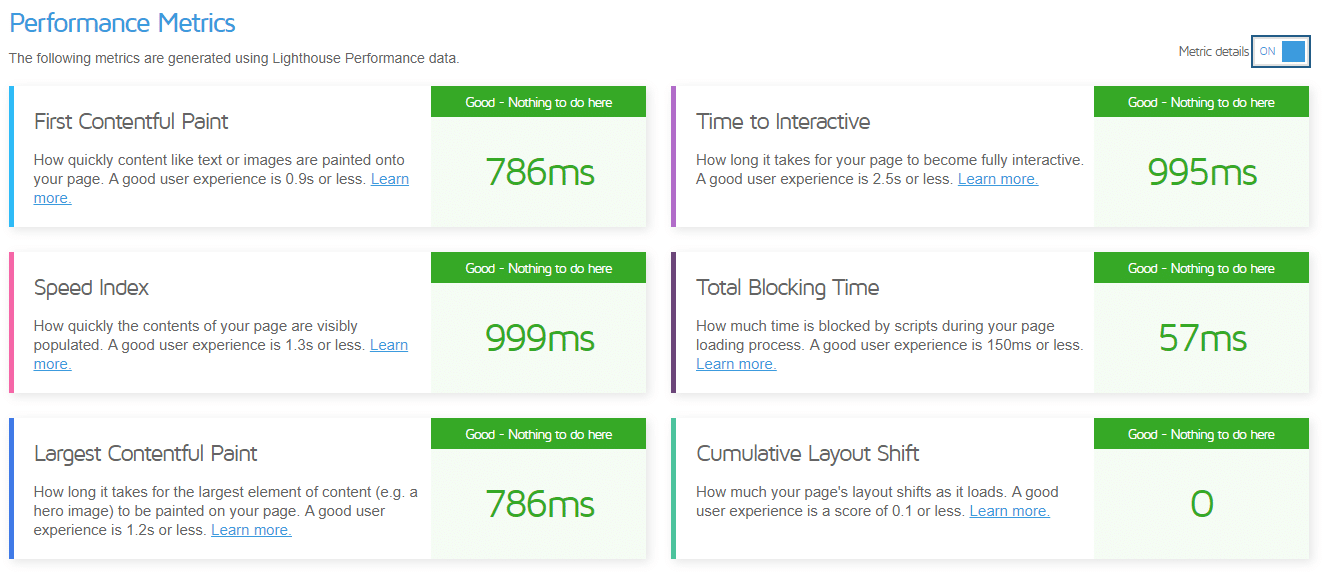
The Performance tab, then, gives you a full overview of the Lighthouse metrics:
We recommend you explore the other tabs as well: they will give you useful insights about your site performance.
How to Analyze the Lighthouse Performance Report
Once you’ve got to the report, the next step is to analyze the results and identify how you can improve your site’s performance score.
⚠️ Be sure to click the ‘View Report’ button when you get there otherwise you’ll be stuck with just the headlines and not the detail.
When you click into the detailed report, you’ll be able to look at every component individually and see exactly what is going on, including diagnostics and the audits passed. Read the report carefully and make sure you open all the tabs to check all the metrics (Performance, Accessibility, Best Practices, SEO, and Progressive Web App).
Take your time working through each one and looking at where Lighthouse is suggesting improvements. Typically the messaging is quite straightforward and intuitive, so you should be able to take those pieces of advice on board, go and change what needs to be changed, and then run the report again.
Now, let’s focus on the performance category of our Lighthouse report.
How to read the scores of the Performance section?
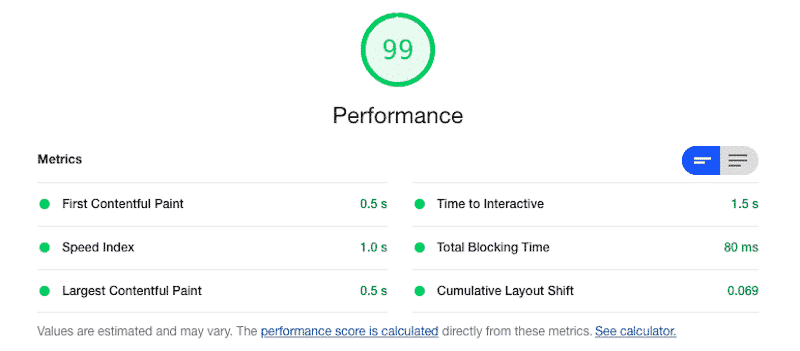
The “Performance” section shows the Core Web Vitals scores (FCP, LCP, and CLS) and the SI, TBT, and TTI metrics.
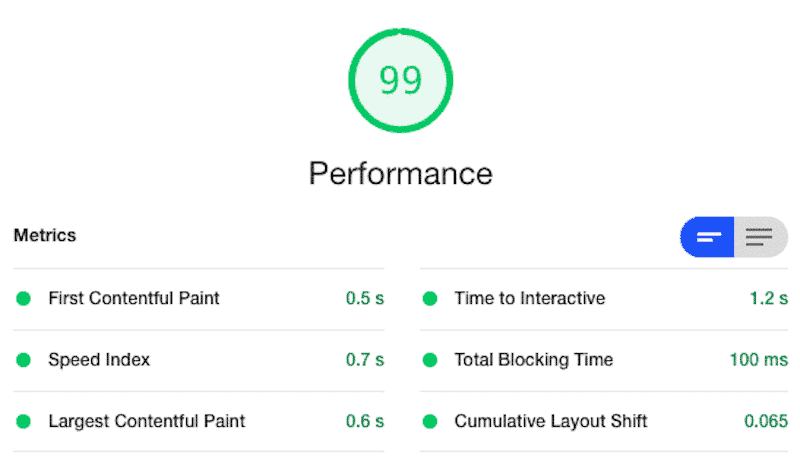
By reading the performance score included above, we can see that:
- The First Contentful Paint is 0,5 s (which is also fine as Google sets the limits at 2,5 s)
- The Speed Index is 0,7 s (which is under the 4.3-s threshold recommended by Google)
- The Largest Contentful Paint is 0.6 s (which is under the 2.5 s recommended by Google)
- The Time to Interactive is 1.2 s (which is fine as the score should be under 5 s)
- The Total Blocking time is 100 ms (which is good, since Google recommends a score under 300 ms)
- The Cumulative Layout Shift is 0,065 s (which is also acceptable by Google, seeing as it’s under 0,1 s).
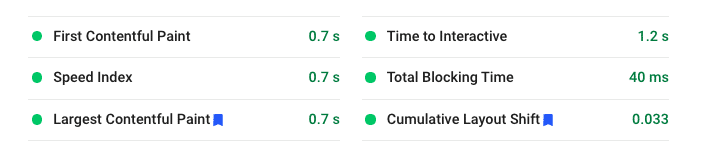
Interpreting a good vs a not-so-good performance score:
Example of a good score (metrics with ⬤ = good)
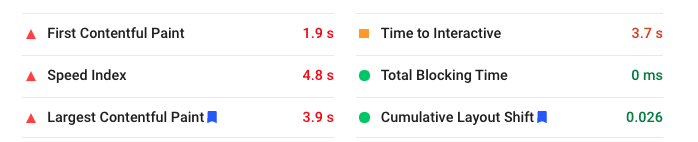
Example of a not-so-good score metrics with ▲ = bad metrics with ◼ = needs improvements
How to Optimize Your Lighthouse Performance Score on WordPress
There are several ways to optimize your Lighthouse performance on your WordPress site. Let’s run through some of them to give you a taste of how you can improve the Lighthouse metrics:
- Set up page caching which speeds up your server response time significantly and helps improve Largest Contentful Paint (LCP). This is part and parcel of the WP Rocket solution.
- Optimize browser caching to ensure that you have the right policies for maintaining static files in your browser. WP Rocket can assist with getting the optimal expiration length automatically here – taking that stress off you entirely. You’ll take care of the LCP grade once again.
- Optimize your fonts, your images, and your code to ensure that you’re not loading unnecessary CSS or unused JavaScript files that get in the way of your main content (and the LCP score). You can do this sort of optimization easily with the File Optimization tab in WP Rocket which helps to eliminate render-blocking resources, avoid chaining critical requests, minify JS and CSS files, remove unused CSS, and lazyload your images. You can also use a tool like Imagify to optimize the size of your image on your WordPress site.
- Optimize your fonts – for instance, use font preloading to improve the Cumulative Layout Shift (CLS) performance.
- Use a content delivery network (CDN) if you’re operating in multiple countries so you can ensure that you deliver a great experience all across the world. Our RocketCDN service is perfect for improving LCP.
- Use server-level compression to reduce your site’s file size for fasting loading. WP Rocket automatically enables Gzip compression for this purpose and takes care of the LCP score, too.
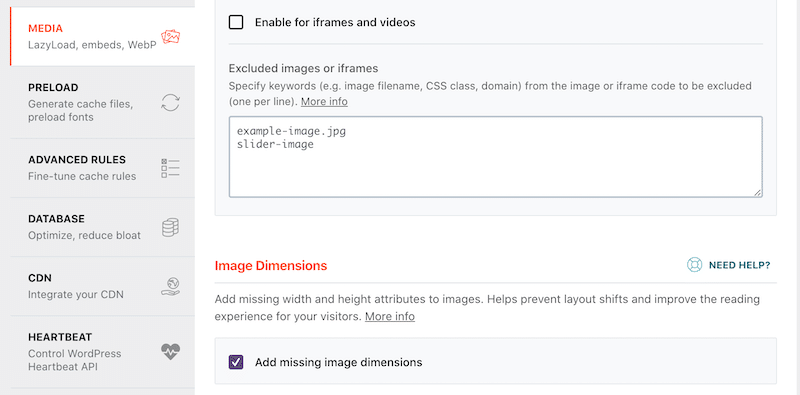
- Ensure all your images and embeds have dimensions – especially those that you are adding manually using your code. WordPress will automatically add for any images you upload through the editor, but it can’t catch the manual ones. This action will help you improve CLS.
- Don’t dynamically inject any content above existing content unless it’s in response to a user’s action. Once again, you’ll reduce the Cumulative Layout Shifts.
- Defer or remove unnecessary JavaScript or CSS – if you’re struggling to improve Time to Interactive (TTI) and Total Blocking Time (TBT), you should look at whether there is any unnecessary JavaScript and CSS that is slowing down the rendering of the page. These are normally the common culprits. If you don’t feel comfortable with JavaScript and CSS optimization, WP Rocket has options to deal with both cases and helps you eliminate both CSS and JS render-blocking.
- Minimize main thread work or reduce JavaScript execution time to improve Speed Index (SI).
Those are just a few examples of things you can do to optimize your Lighthouse score. As you can see, WP Rocket is a really powerful way to tackle 80% of these issues immediately without you having to worry about a thing. You don’t even need to touch the settings. It’s a plug-and-play tool that delivers exceptional performance improvements almost immediately.
If you’re looking to improve your Lighthouse score and your WordPress site’s user experience as a result, then you should give it a try.
But let’s see how WP Rocket performs in a real-life example. I’m going to audit a website with and without WP Rocket to help you make up your mind.
Measuring and Optimizing My WordPress Site Performance With Lighthouse and WP Rocket
The performance measuring tool chosen for the test is PSI.
Scenario 1: Running the analysis without WP Rocket installed
- First, we need to go to PSI
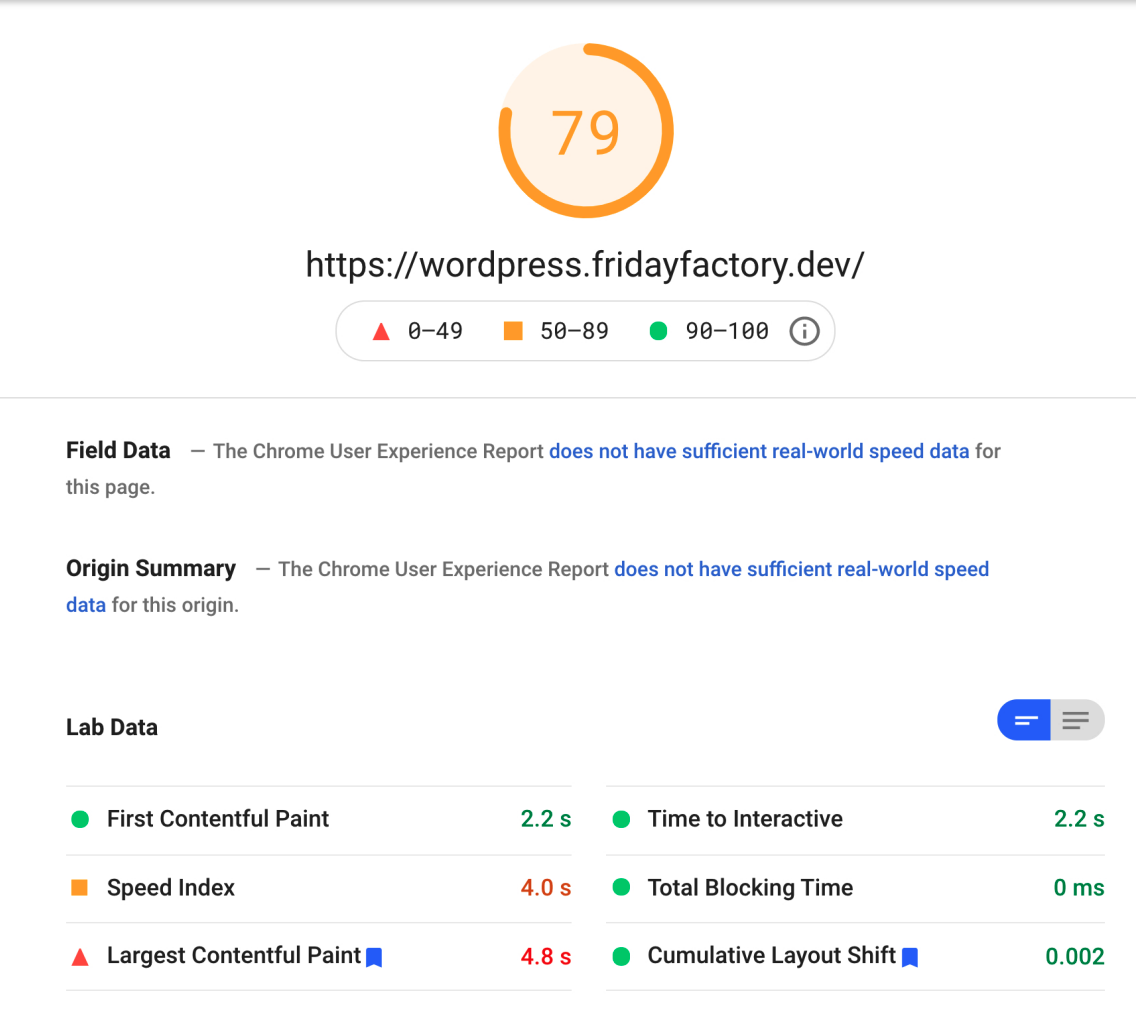
- Then, we run the report for the following website: (URL: https://wordpress.fridayfactory.dev/)
I’ve selected the “mobile” device as it’s the hardest to optimize. Of course, you can run a similar report using the “Desktop” mode.
![]()
My Speed Test Results
Let’s dig into each KPI of the Lighthouse report:
And here are the Lighthouse report’s details:
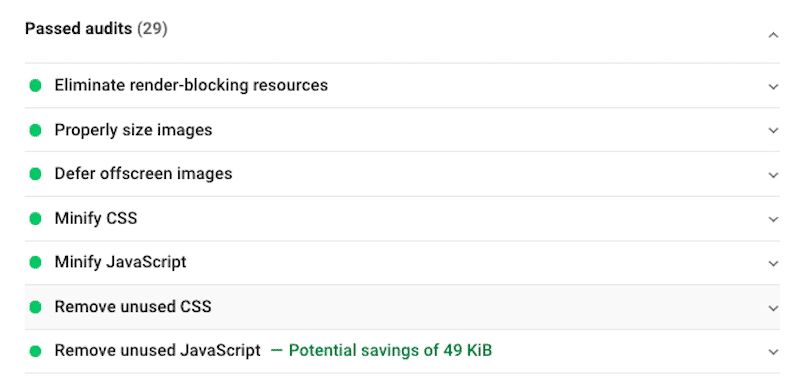
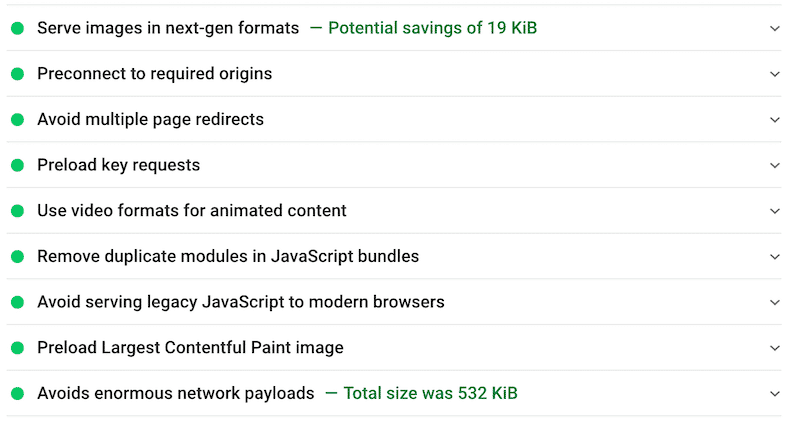
Extract from the passed audits (24)
There is nothing to optimize here, good news!
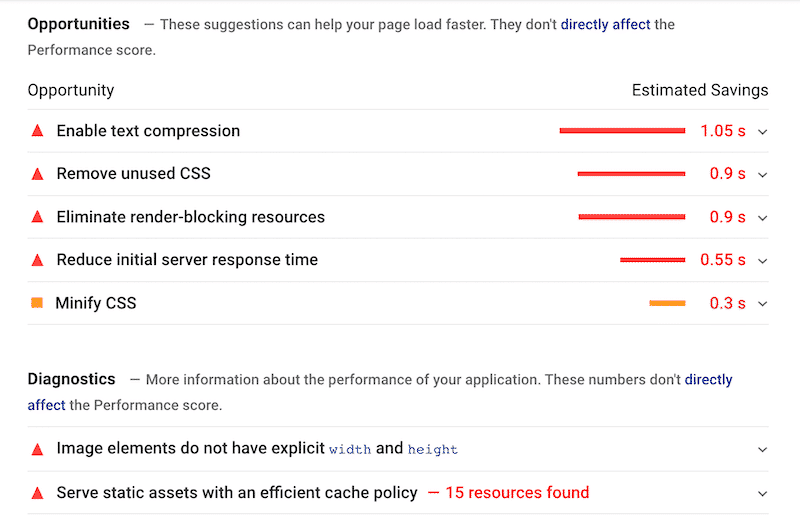
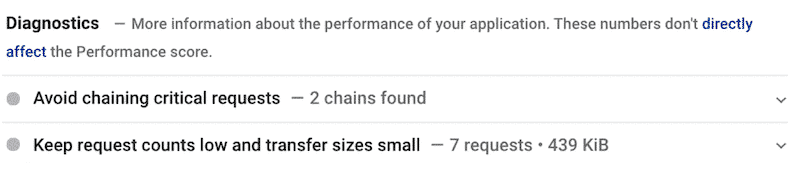
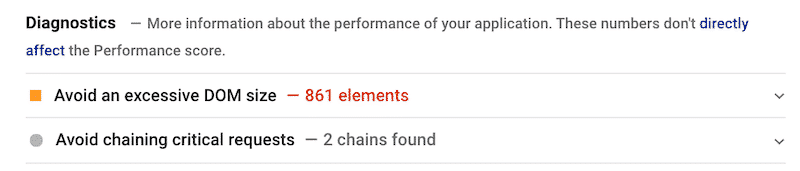
Opportunities and Diagnostics found on mobile:
This section highlights the main issues to address after performing the audit. Stay with us because, in the second part, I’ll show how to fix them with WP Rocket.
When running the performance test, Lighthouse suggested a few improvements to make, such as:
- Images do not have explicit width and height
- Minify CSS and remove unused CSS
- Enable Text Compression (GZIP)
- Eliminate render-blocking resources
- Set an efficient caching policy.
Scenario 2: Running the very same analysis with WP Rocket
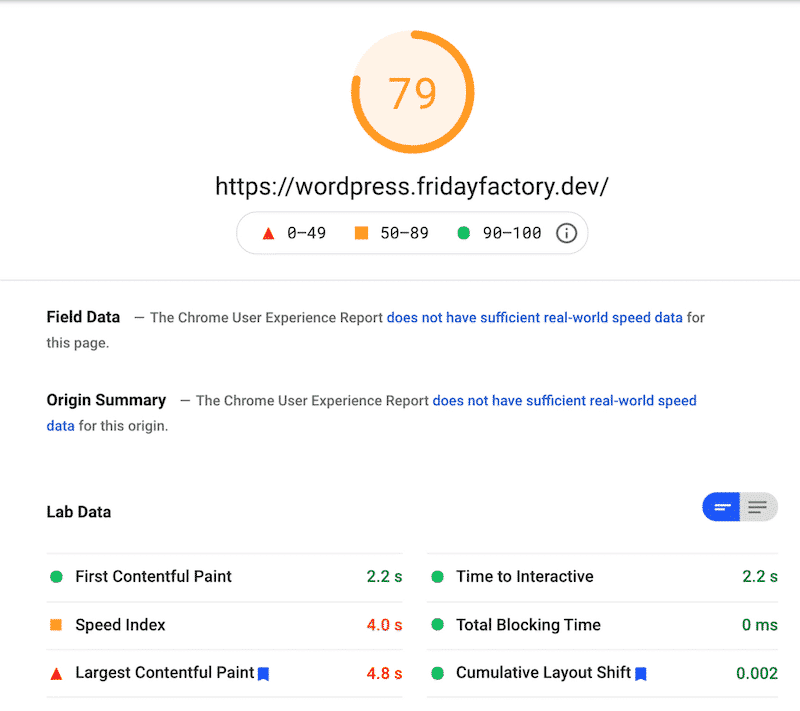
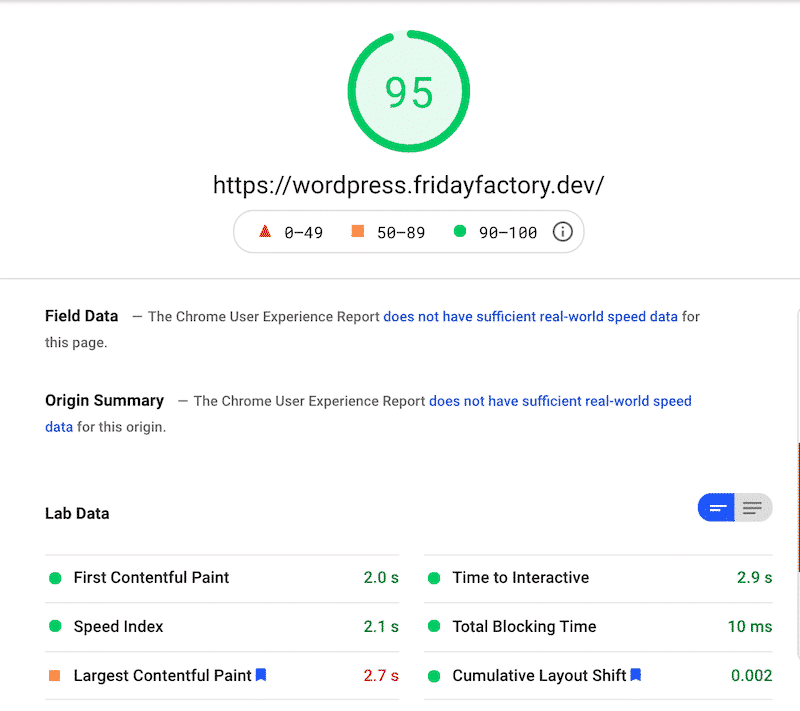
In order to improve my current score (79/100) to at least (90/100), I have activated WP Rocket on the very same website.
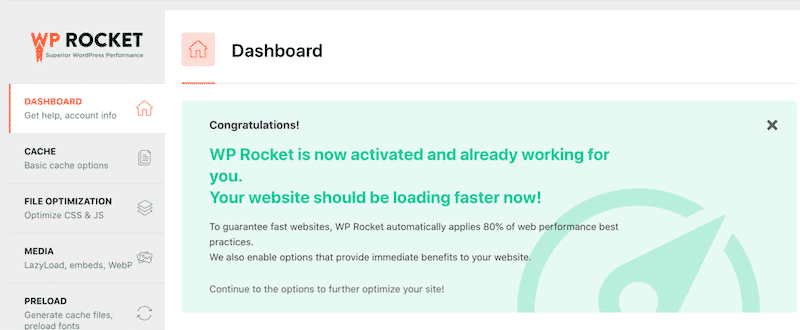
The improvement that I’m getting out-of-the-box is already very encouraging. My Speed Index indicator is now in the green!
The LCP has improved, but it’s still in “orange”. Stay with us: we’ll show how to improve the LCP grade and the overall performance score by taking advantage of some powerful WP Rocket’s features.
| Hint: WP Rocket automatically applies the 80% of web performance best practices, right upon activation. |
If you feel like exploring the settings, I’ve combined a few best practices to keep in mind while you configure WP Rocket:
- Don’t activate all the options at once. Take your time, check them one by one and run new tests every time that a new option is activated.
- When running a new test, make sure that you’re doing it in an incognito window and/or logged-out of your WordPress site:
How to improve the Lighthouse performance score with WP Rocket
So, remember our performance issues listed on the Lighthouse report? I’m going to show you how to tackle them using WP Rocket.
❌ Problem #1: Images dimensions missing
In the diagnostics section, I had the following issue: “Image elements do not have explicit width and height”, meaning that I have to check each of them (75!) and add a specific width and height.
🚀 The solution from WP Rocket – In the dashboard, go to Media > Image Dimensions, and check the box “Add missing image dimensions”. WP Rocket will add width and height attributes for the image.
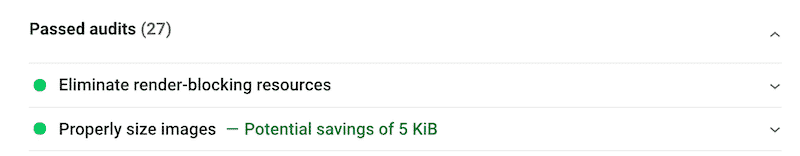
⏱️ Let’s run a new audit in PSI (still in incognito mode) so we can compare the results. Good news, my diagnostic section does not have “Image elements do not have explicit width and height” anymore:
Actually, the issue is gone and the “Properly size image” KPI has now been moved to the “Passed audits” section:
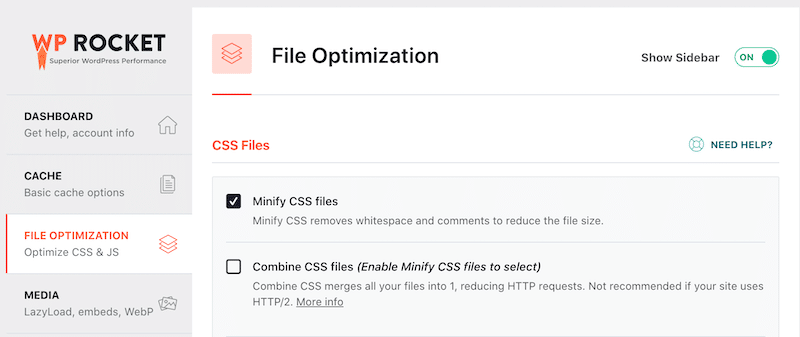
❌ Problem #2 – Minify CSS
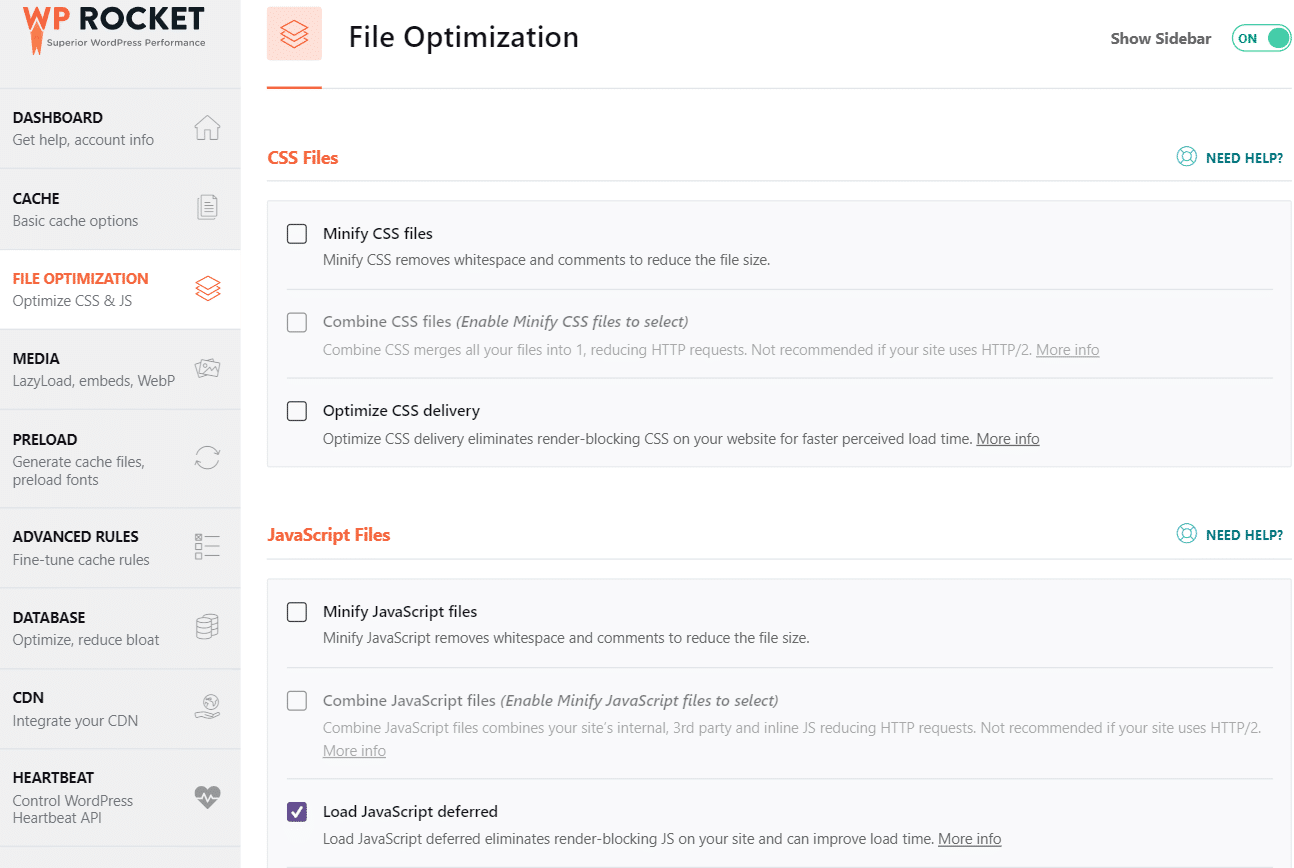
🚀 The solution from WP Rocket – In the File Optimization tab, WP Rocket offers to minify the CSS files as shown below:
❌ Problem #3 – Eliminate render-blocking resources
🚀 The #1 solution from WP Rocket – WP Rocket offers a powerful feature to deal with JS render-blocking: “Load JavaScript deferred”. You only have to select the option, and the plugin will take care of everything:
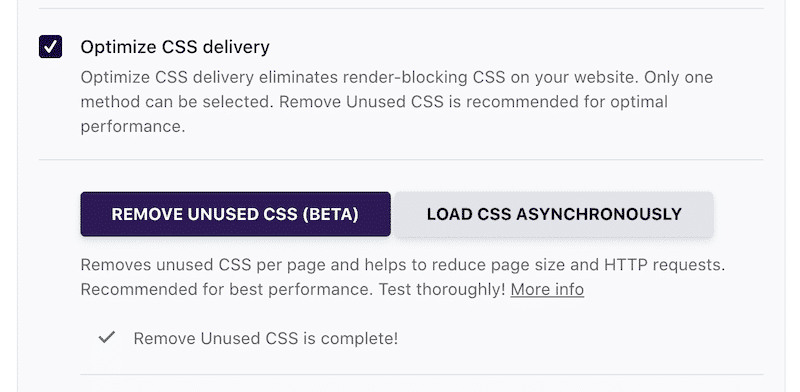
🚀 The #2 solution from WP Rocket – WP Rocket helps you deal with CSS render-blocking thanks to the Optimize CSS Delivery feature.
⏱️ Let’s run a new audit in PSI (still in incognito mode) so we can compare the results. Again, good news, my Diagnostics section does not contain any CSS or JS related issues anymore:
My final performance grade on mobile after activating WP Rocket and tweaking a few settings in the WordPress dashboard is really good:
| My orange scores when I run my first audit without WP Rocket – PSI | 🚀 My new (green) scores after installing WP Rocket – PSI |
 |
 |
Wrapping Up
In conclusion, I can say that WP Rocket has definitely helped with the improvement of my overall Lighthouse performance score.
| Before WP Rocket | 🚀 With WP Rocket | |
| Overall Performance Grade |  |
 |
| LCP score | 4,8 s | 2,4s |
| FCP score | 2,2s | 2,0s |
| CLS score | 0,002s | 0,002s |
| SI score | 4,0 | 2,3s |
| TBT score | 0s | 0s |
| TTI score | 2,2s | 2,0s |
| Number of passed audits | 21 | 27 |
| Number of opportunities and diagnostics | 7 | 1 |
Hopefully, this article has helped demystify the Lighthouse performance metrics and give you some concrete steps to optimize your WordPress site page speed.
As mentioned, the easiest and most convenient way to do this is by installing WP Rocket. The plugin will automatically enable a range of features and optimizations that will get your site into tip-top shape in no time.
But even if you don’t use WP Rocket, spend the time and energy needed to understand these concepts and apply the best practices to ensure that your site gets the attention it deserves. It’s an investment that will pay itself back a million times over if you want to be Google’s best friend.