
Table of Contents
Last update on
GTmetrix is one of the best alternatives to PageSpeed Insights when it comes to measuring the performance of your site.
At WP Rocket we use GTmetrix daily, along with other performance testing tools, to help our customers audit their sites and making the most of its recommendations.
While PageSpeed mostly focuses on colors and score to guide users through its recommendations, GTmetrix counts on a more classic interface, where its waterfall plays the leading role.
Several customization options (test server region, type of browser, etc.) make the experience with GTmetrix complete and reliable.
In this tutorial we’re going to deep dive into GTmetrix, and you’ll understand why it’s a very valid tool to assess the real performance of your website.
What Is GTmetrix and How Does It Work?
GTmetrix is the free performance testing tool built by the people of GT.net, a hosting company based in Vancouver, Canada. They provide dedicated, clustered, and private cloud hosting solutions, plus a specific toolset dedicated to performance: among them, there’s GTmetrix.
The first thing we suggest doing before running a performance test with GTmetrix, is to create a free account.
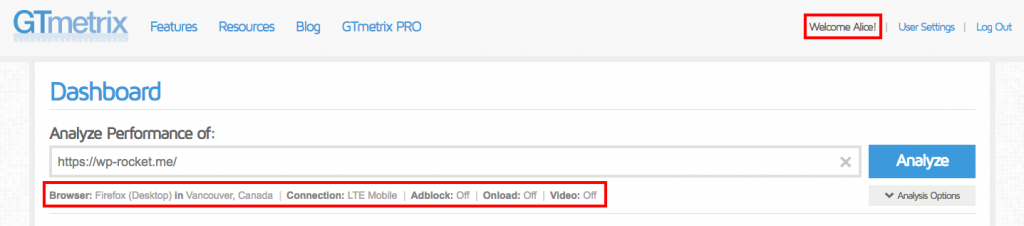
This allows you to customize your test and have a more reliable performance result.
How to Customize Your GTmetrix Test?
There are several options that you can tweak to customize your testing experience with GTmetrix. Let’s see them together.
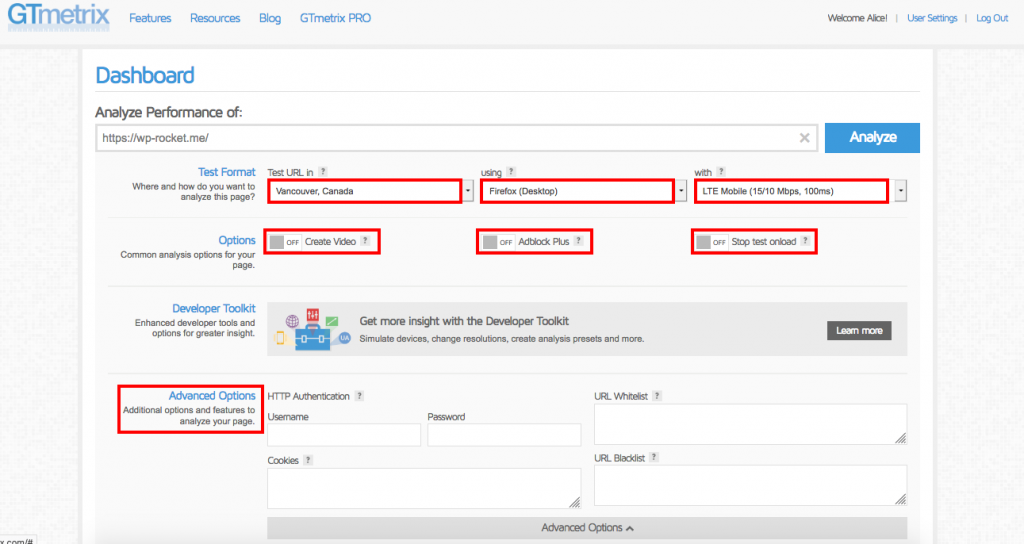
Location (Test Region)
There are 30 test servers available to try. As we mentioned in our article about how to correctly measure your website’s speed, the first step to get reliable results for speed tests is to choose a location as close as possible to your server.
This means that if your server is located in Europe, testing your speed from Canada would give you a misleading result, unless you’re targeting Canadian audience, too. In this case, don’t forget to enable a CDN on your site!
You can find GTmetrix servers’ locations here.
Browser
You can choose between:
- Firefox for Desktop
- Chrome for Desktop
- Chrome for Android (Galaxy Nexus)
Connection
Now that Google switched to mobile-first indexing, being aware of how your site performs on different types of networks is crucial.
GTmetrix gives you several possibilities:
- Unthrottled Connection
- Broadband (slow, fast, and normal)
- 3G Mobile
- 2G Mobile
- LTE Mobile
- 56K Dial-up
AdBlock
With this option you can see the impact Ads have on your site. When you tick the AdBlock option, GTmetrix will scan your URL while ads are blocked.
You can check a real case example on GTmetrix’ site, where they used Smashing Magazine website.
Stop Test Onload
This will stop the speed test right after the Onload event, instead of after 2 seconds of network inactivity (which is the default for GTmetrix, and is referred to as Fully loaded time).
The Onload event is when the overall processing of the page is over, and all the resources of the page have been downloaded.
The inconvenience of using this option is that, sometimes, not all the elements of the page are downloaded before the Onload event fires (think about JavaScript based images carousels, or similar behaviors)
As a result, page load times measured when this option is enabled could be inconsistent.
That’s why, by default, GTmetrix will test your site considering the Fully loaded time: it waits for the Onload event to fire (including ads and below the fold elements) and then waits for a network inactivity of 2 seconds.
It’s important to consider that a website can be perfectly usable in a shorter amount of time than that indicated by the Fully loaded time.
Create Video
If you want to see how your page loads exactly, you can enable the Video option.
GTmetrix will record a video where you’ll see your page loading 4x slower, so it would be easier to detect eventual loading issues.
How To Read GTmetrix Tabs and Interpret Their Results
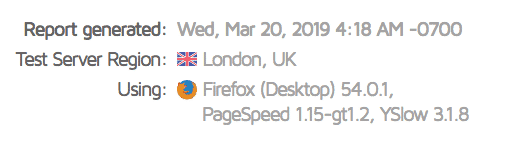
Once you launch a GTmetrix report, you’ll see all the info concerning the performance of your site.
First of all, you have a summary of the testing options you chose:
The nice thing about GTmetrix is that it allows you to see several types of metrics, including those coming from other testing tools, like PageSpeed and Yslow.
That’s why you’ll see the external performance scores on the left (GTmetrix doesn’t calculate one of its own), and the page details on the right:
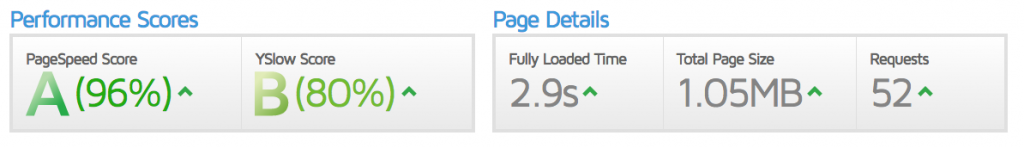
The page details are the most important and immediate info you can have on your website performance:
- Fully loaded time, expressed in seconds
- Total page size, in MB
- Number of HTTP requests
This is a great start to understand how your site is performing. 🙂
As we explained in our guide about page speed optimization for WordPress, different speed tools can provide different load times or performance results.
This statement becomes immediately clear when looking at GTmetrix’ tabs.
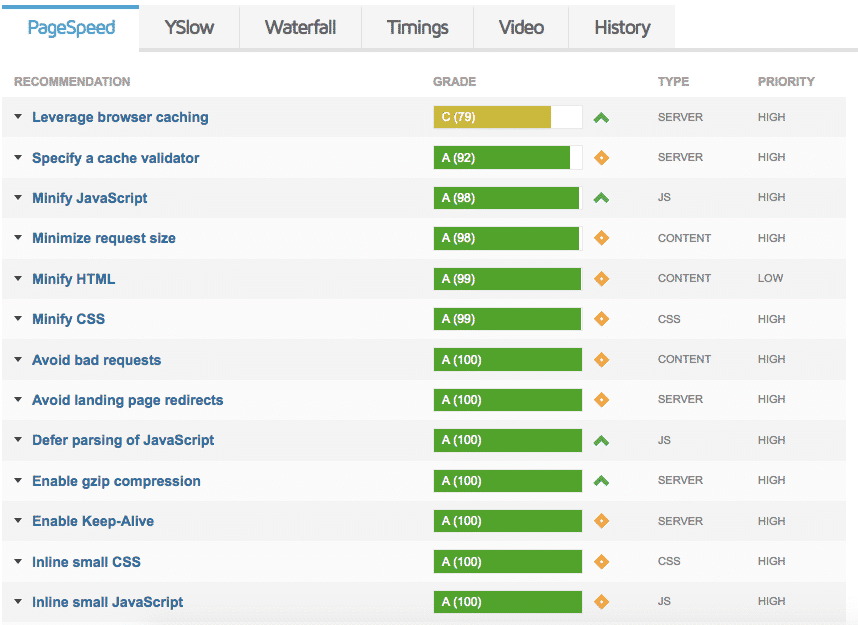
Here’s the list of recommendations in the PageSpeed tab:
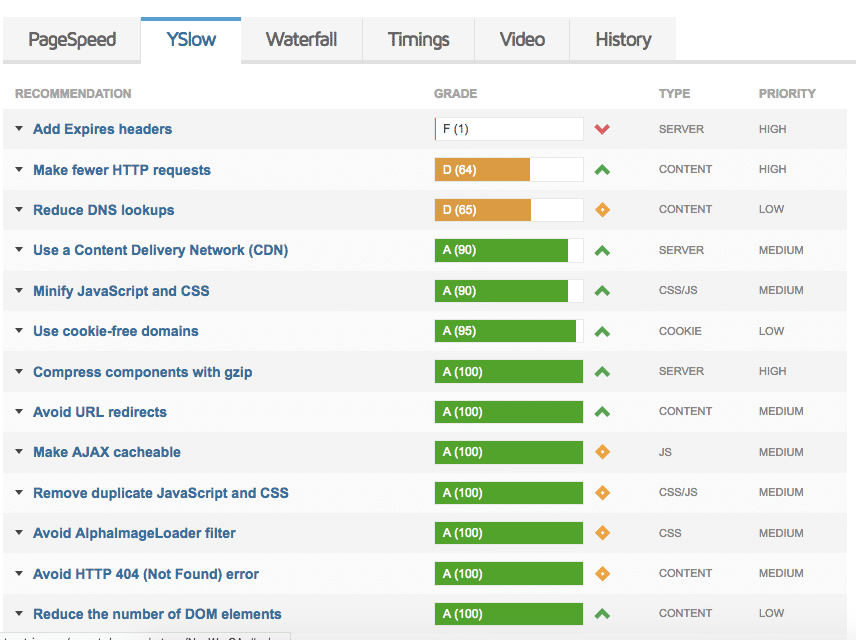
And here’s how, the same website, scores under the YSlow tab:
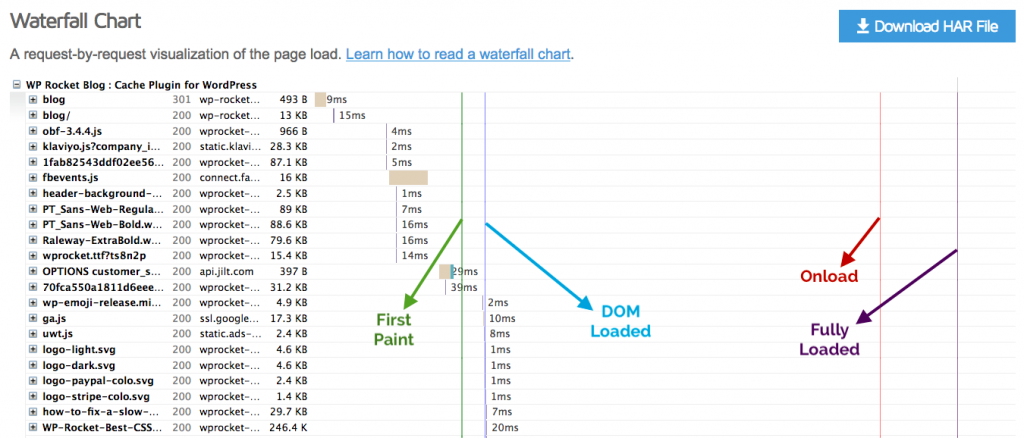
Diving Into the GTmetrix Waterfall Chart
To dive deep into the details of your site’s performance, you have to click on the third tab and read GTmetrix’ Waterfall Chart.
The Waterfall Chart describes the loading behavior of your page, by dissecting every request and measuring its timing.
It contains every script, media file or external resource included in the tested page.
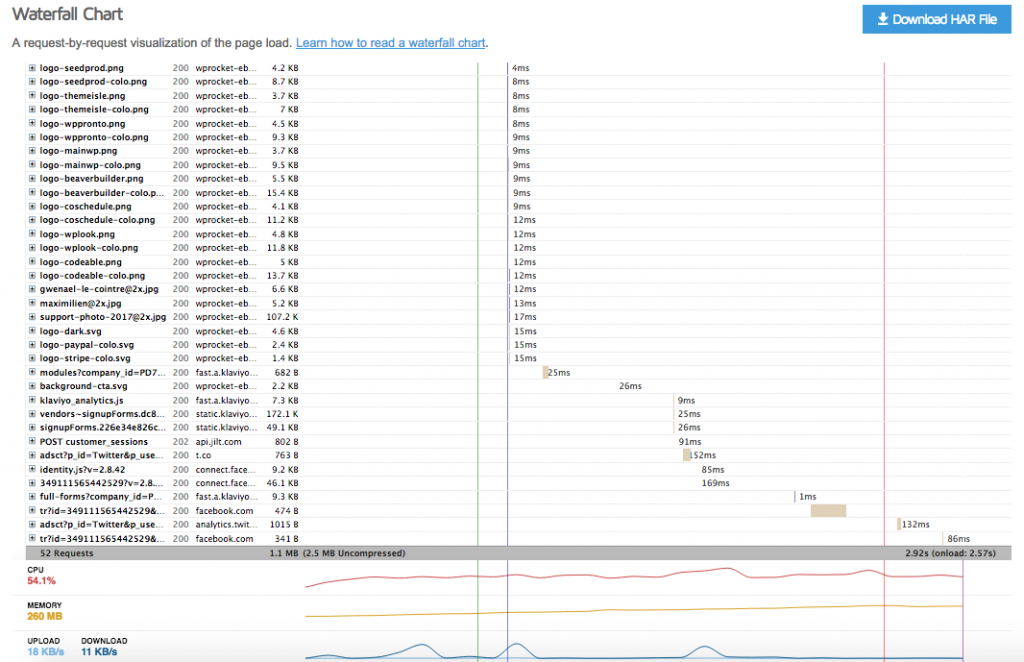
This tab is very useful to have an idea of what resources your page loads, and in which order.
For every request you have its loading time, represented by horizontal bars: the longer the bar, the slower the request will take to download/execute.
GTmetrix Waterfall Chart includes five columns; from left to right:
- File Name of the requested resources;
- HTTP Response Status returned from the server for that resource;
- File Origin, that is where the resource is coming from;
- File Size for each resource;
- Load Time Breakdown, which represents the time needed to download/execute each resource.
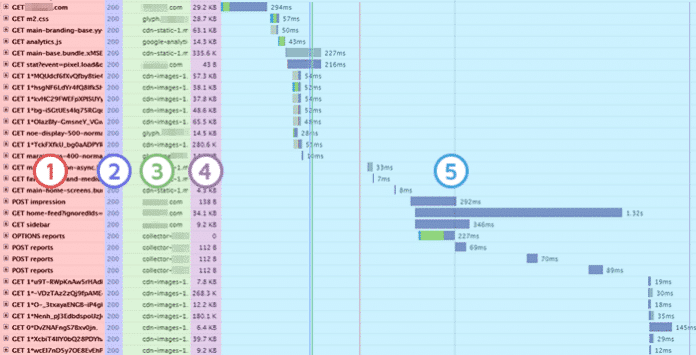
Source: GTmetrix Blog
If you hover the file name, you’ll be able to read the full path of the selected file. And if you Ctrl+click on it, you can open the file in another tab, to better identify it and see its content.
Since you’re using WordPress, it will be easy to understand if that file is coming from one of the plugins or theme you’re using.
At this point, you have in front of you a very clear picture of how well your site is doing.
Before proceeding to the load time breakdown section, keep an eye on the fourth column, File Size.
If you notice large file sizes here, note down the file and try to fix it: are they images or videos? In this case, have a look at our comprehensive guide on how to optimize images and reduce their file size.
Load Time Breakdown
The color code that GTmetrix designed is helpful to distinguish the different parts of the loading process for each resource.
Hovering on the load time bar for each resource will open a pop-up where the different phases of the resource’s loading process are expressed in different colors:
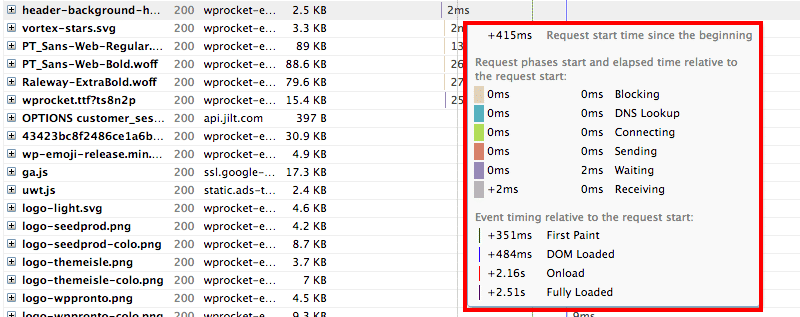
- Brown for blocking
- Teal for DNS lookup
- Green for connecting
- Red for sending
- Purple for waiting
- Gray for receiving
In addition to the relative time of each phase of the request execution, GTmetrix also indicates the event timing, which is the specific timing at which certain milestones are reached.
There’s a color code for event timings as well:
- A green line depicts the moment when the very first rendering begins on the page (first paint);
- The blue line indicates the moment in which the browser considers the DOM ready.
- The red line is the Onload, that is when the page and all its components have downloaded and are processed by the browser.
- With the purple line we see the fully loaded event: the Onload has fired and there hasn’t been any network activity for 2 seconds.
Some of these lines are represented also in the next GTmetrix tab, labeled as Timings.
The Timings tab
This tab is very helpful because it provides a clear and visual explanation of the different moments in which the loading time of your page is being split.
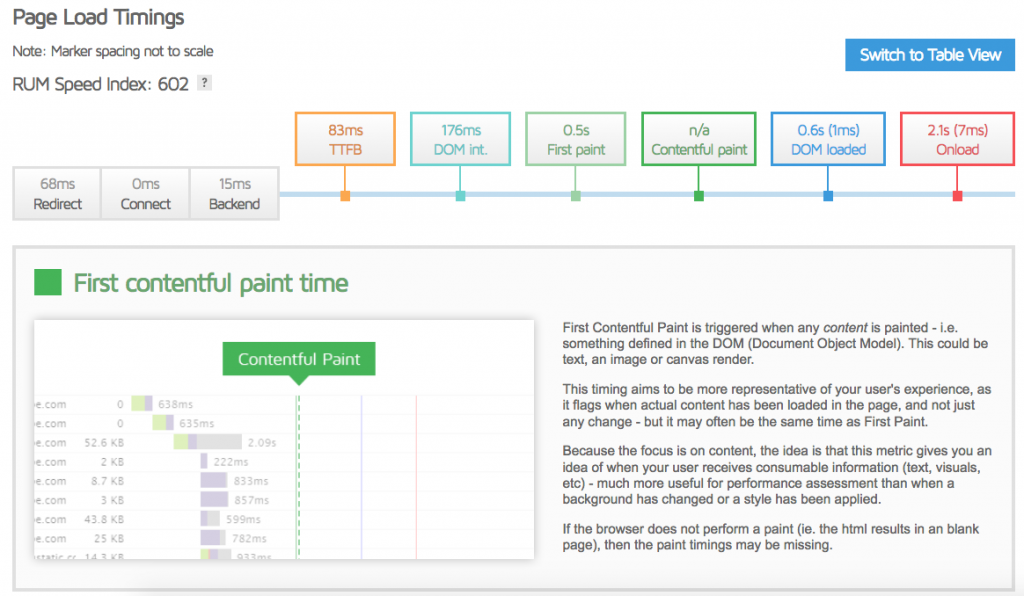
In the image above you can see the info included in it. You’ll have an indication of the time needed for eventual redirects, connection, and backend duration. Then you’ll be able to see how long the Time to First Bytes takes, followed by DOM interactive time, First Paint, Contentful Paint, DOM loaded and Onload.
What we like the most about the tab, is how GTmetrix team takes the time to explain the meaning of every metric, in plain English.
Super useful to have a first grounding on the complex process of page loading!
The last two tabs of any GTmetrix report are Video and History.
The first one records a video of your page loading (bottlenecks included), while the second one shows the history of the performance of that same tested page.
Wrapping Up
In this article you got to know GTmetrix, one of the best performance testing tools that you can use as an alternative (or along with) PageSpeed Insights.
The good thing about GTmetrix is that it provides not only instant indicators of speed and performance (like loading time in seconds, and scores), but also a comprehensive set of tabs to explore: from the Waterfall Charts to the Event Timings, to the Timings tab, plus a bunch of great insights and explanations about performance indicators.
Now it’s time to go ahead and learn about other performance testing tools and how to use them: