
Table of Contents
Last update on
Core Web Vitals WordPress scores help you understand how your site actually feels to visitors. Does it load quickly? React smoothly when someone clicks or taps? Stay visually stable instead of shifting around as the page loads?
To help measure that user experience, Google introduced Core Web Vitals in 2020. They focus on three key areas: Largest Contentful Paint (LCP) for loading performance, Interaction to Next Paint (INP) for responsiveness, and Cumulative Layout Shift (CLS) for visual stability.
They matter because a better experience is good for your visitors and for SEO too. Core Web Vitals are part of the page experience Google considers in its ranking systems, although they are only one piece of the overall SEO puzzle.
In this guide, you’ll learn how to test your Core Web Vitals in WordPress, understand your scores, and fix the issues affecting your site’s performance.
TL;DR
Core Web Vitals are Google’s key metrics for measuring loading speed, responsiveness, and visual stability. To improve them on WordPress, first identify which metric is causing problems and whether the issue affects real users. Use PageSpeed Insights for a quick overview, GTmetrix for deeper diagnostics, and Google Search Console to spot recurring issues across your site. Then apply targeted fixes, retest, and keep monitoring performance as your site evolves.
Key Takeaways
✅ Core Web Vitals measure three parts of user experience: loading performance with LCP, responsiveness with INP, and visual stability with CLS.
✅ Aim for an LCP within 2.5 seconds, INP within 200 ms, and CLS under 0.1.
✅ Focus mainly on field data for Core Web Vitals evaluation because it reflects your real visitors. Use lab data to diagnose problems and test fixes.
✅ WP Rocket can help address many of the performance issues affecting Core Web Vitals, such as caching, removing unused CSS, optimizing JavaScript execution, font loading, and rendering.
What Are Google Core Web Vitals?
Google Core Web Vitals are three metrics that measure how your pages feel to real visitors: how quickly the main content appears, how fast the page responds to an interaction, and whether the layout stays stable while loading.
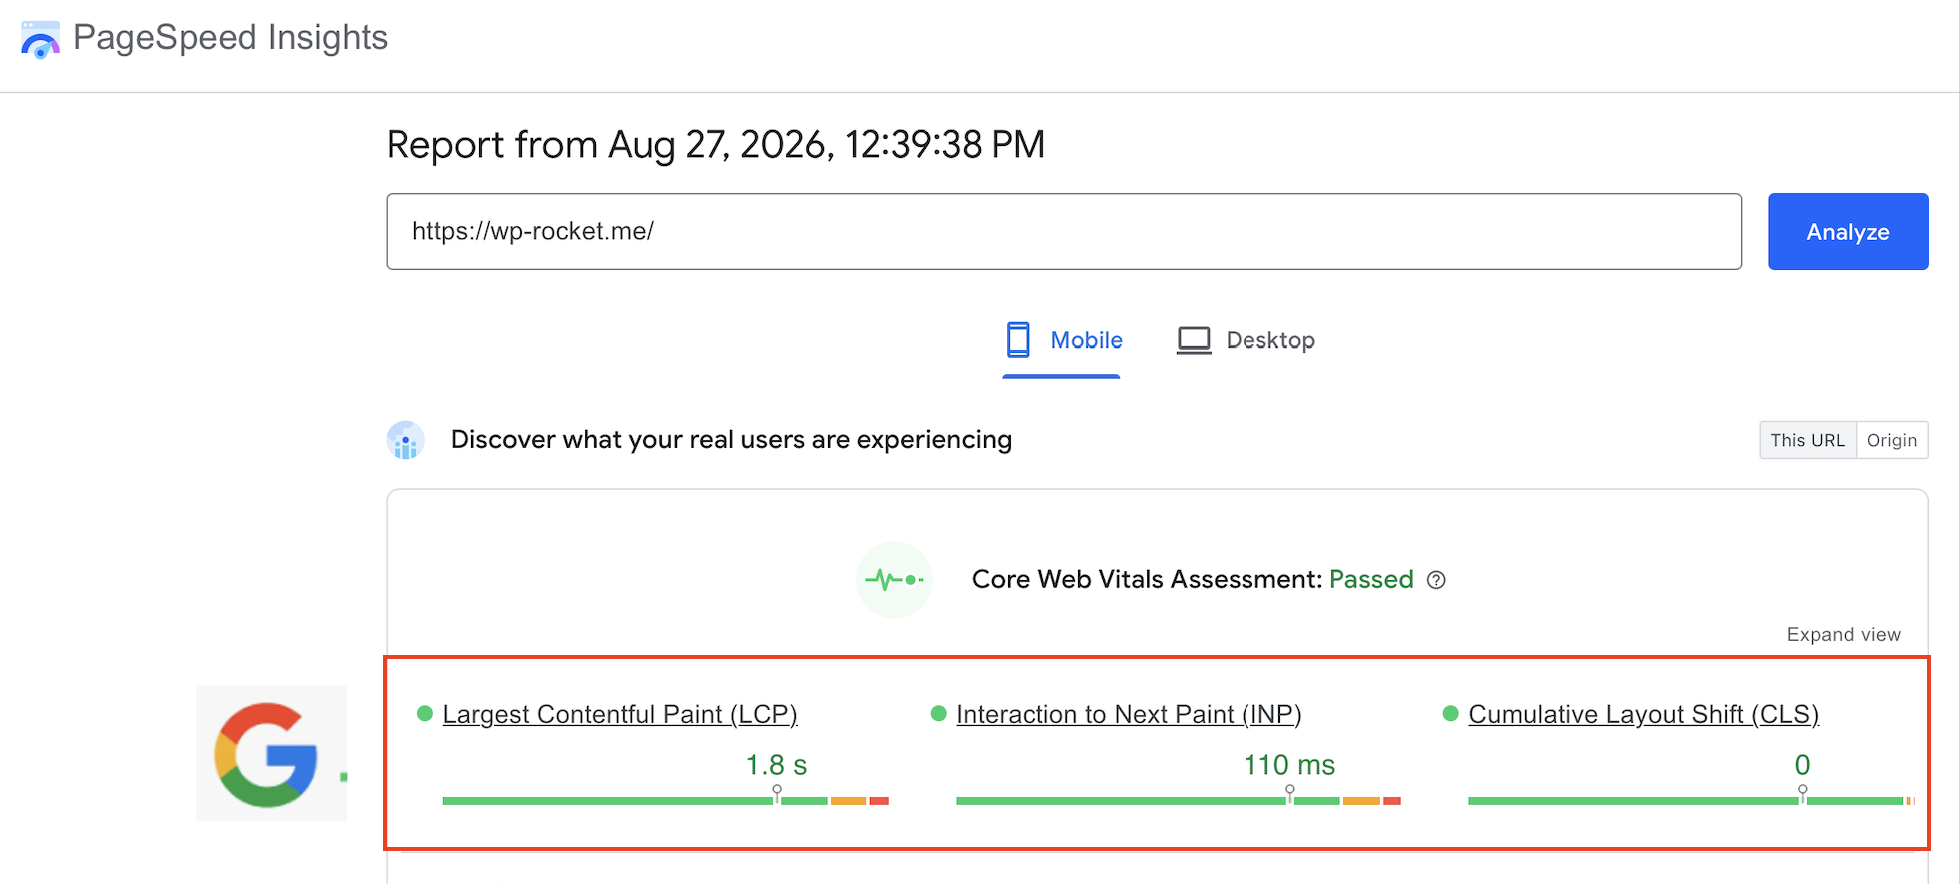
Let’s look at each metric.
Largest Contentful Paint (LCP): How Fast Does the Main Content Appear?
Largest Contentful Paint (LCP) measures how long it takes for the largest visible content element to appear. On a WordPress page, this is often a hero image, featured image, large heading, or product image.
💡 For example: You open a WooCommerce product page, but the main product image takes several seconds to appear. Even if other elements are already visible, the page can still feel slow because its most important content is missing.
Interaction to Next Paint (INP): How Quickly Does Your Page Respond?
Interaction to Next Paint (INP) measures responsiveness. It looks at how quickly your page gives visual feedback after someone clicks, taps, or uses the keyboard.
💡 For example: A visitor clicks your mobile menu, adds a product to their cart, or opens an accordion built with a page builder. If nothing seems to happen for a moment, the page feels unresponsive and your INP may be too high.
Cumulative Layout Shift (CLS): Does Your Page Stay Put?
Cumulative Layout Shift (CLS) measures visual stability. It tracks unexpected movements of content while the page is loading.
💡 For example: You’re about to click a button, but a late-loading image, font, cookie banner, or ad pushes it down the page. You click on something else instead. That’s exactly the kind of frustrating experience CLS measures.
What Are Good Core Web Vitals Scores?
Google recommends the following thresholds for a good user experience:
| Core Web Vital | What It Measures | Good Score |
| LCP | Loading performance | Within 2.5 seconds |
| INP | Responsiveness | Within 200 ms |
| CLS | Visual stability | Under 0.1 |
Which Core Web Vital Should You Fix First?
Once you have your Core Web Vitals results, use them to decide what to optimize first. Check both mobile and desktop, as the biggest performance issue may differ between devices.
Then, look at which metric is failing and match it to the problem your visitors are experiencing.
Use the recommendations below to decide where to start, based on the Core Web Vital that needs the most attention.
Your LCP Is Poor: Fix Loading Performance First
A poor LCP means the main content is taking too long to appear. On WordPress, the cause is often a slow server response, a heavy hero or featured image, or CSS and JavaScript delaying the initial render.
Start with the following optimizations:
- Enable page and browser caching.
- Optimize the LCP image, including its size, format, and loading priority. Because the LCP image is often the largest visible element above the fold, the browser needs to discover and load it as early as possible.
- Remove unused CSS and reduce render-blocking resources.
- Defer and delay non-critical JavaScript.
- Improve server response time so the browser can start loading the page and LCP element sooner and using a CDN to reduce delays for distant visitors.
| 📖 Want to improve your LCP? Learn how to improve LCP on WordPress and make your main content load faster. |
Your INP Is Poor: Fix Page Responsiveness First
A poor INP means your page is taking too long to respond when visitors interact with it. Heavy JavaScript, plugins, page builders, and unoptimized third-party scripts are common WordPress causes. To reduce their impact, remove unnecessary third-party scripts and delay non-essential ones until they’re actually needed.
Take advantage of these actions:
- Remove unnecessary JavaScript and scripts you no longer need, such as old tracking tags or unused third-party widgets.
- Delay and deferr non-critical JavaScript, such as chat widgets or social sharing scripts that are not needed immediately.
- Reduce long tasks and main-thread work, for example by splitting heavy JavaScript so the browser does not process everything at once.
- Remove unused CSS and unnecessary code.
- Check heavy plugins, widgets, filters, and third-party scripts that run during interactions.
| 📖 Need to fix a poor INP? See how to fix INP on WordPress and make your pages respond faster to clicks and interactions. |
Your CLS Is Poor: Fix Unexpected Layout Shifts First
A poor CLS means elements are moving unexpectedly while the page loads. Images, fonts, embeds, ads, and dynamically injected content are common causes.
Here are the key optimizations to apply:
- Add width and height dimensions to images and videos.
- Reserve space for ads, embeds, banners, and iframes.
- Optimize font loading to reduce FOUT and FOIT which can cause text to appear, disappear, or change style while fonts load. FOUT shows fallback text first, then swaps to the final font, while FOIT keeps text invisible until the font is ready.
- Avoid content that is dynamically inserted above content already visible on the page.
| 📖 Struggling with layout shifts? Follow our guide to reduce CLS on WordPress and keep your content visually stable while loading. |
How to Fix Each Core Web Vital at a Glance
Use the table below to identify the most common problem, decide what to fix first, and see how a performance plugin can help. For instance, WP Rocket includes several features that address common causes of poor Core Web Vitals and help optimize them.
| FailingMetric | What It Means | Good Result | Common Causes | First WordPress Fix | 🚀 WP Rocket Features to optimize Core Web Vitals |
| LCP | How quickly the main content appears | ≤ 2.5 s | Slow server response, heavy images, render-blocking CSS or JavaScript | Caching, image optimization, CSS and JavaScript optimization | Page Caching, Optimize Critical Images, Remove Unused CSS, Load JavaScript Deferred, Delay JavaScript Execution |
| INP | How quickly the page responds to interactions | ≤ 200 ms | Too much JavaScript, long tasks, busy main thread | Reduce JavaScript and main-thread work | Delay JavaScript Execution, Load JavaScript Deferred, Remove Unused CSS, Automatic Lazy Rendering |
| CLS | How visually stable the page is | ≤ 0.1 | Missing image dimensions, ads or embeds, FOUT from web fonts | Reserve space and optimize font loading | Add Missing Image Dimensions, Preload Fonts, Self-host Google Fonts |
📖 WP Rocket Features for Core Web Vitals Optimization
Here’s a quick glossary to help you understand what each WP Rocket feature does and how it can positively impact Core Web Vitals.
🚀 This is a list of some optimizations enabled by default upon activation that can directly improve Core Web Vitals performance:
- Caching: It stores ready-to-serve versions of your pages, so the server does not have to rebuild them for every visit. This can reduce server response time and help content load faster.
- GZIP Compression: It reduces the size of text-based files before they are sent to the browser, helping pages transfer and load faster.
- Optimize Critical Images: It identifies and prioritizes above-the-fold images so important visual content can load sooner, which can help improve LCP.
- Automatic Lazy Rendering: It postpones the rendering of off-screen elements until they are needed, reducing the amount of work the browser has to perform during the initial load.
🚀 You can also enable additional Core Web Vitals optimizations in a few clicks:
- Remove Unused CSS: It removes CSS that is not needed to render the page, reducing unnecessary browser work and helping visible content appear sooner.
- Delay JavaScript Execution: It postpones non-essential JavaScript until user interaction, reducing the amount of JavaScript processed during the initial load. This can help improve LCP and INP.
- Load JavaScript Deferred: It lets the browser continue parsing and displaying the page while JavaScript files load, helping prevent scripts from blocking visible content.
- LazyLoad: It loads off-screen images, iframes, and media only when they are about to enter the viewport, reducing what needs to load initially.
- Font optimization: It improves how fonts are loaded so text can appear sooner and layout shifts caused by late-loading fonts are reduced. This can help improve CLS.
Before going over the best WordPress performance tools, it’s important to understand one crucial difference in Core Web Vitals testing: lab data vs. field data. This will help you understand why two tools can show different results for the same WordPress page.
Core Web Vitals Field Data vs. Lab Data
Field data comes from real visitors using your site on different devices, browsers, networks, and locations. It shows how your WordPress site actually performs for your audience over time.
Lab data comes from a simulated test under controlled conditions. It’s useful for finding performance issues, testing changes, and comparing your site before and after optimization.
| 💡 Good to know: For Core Web Vitals evaluation, focus mainly on field data because it reflects real-user experience. Lab data is best used to diagnose problems and test your optimizations. |
Now that this distinction is clear, let’s get to the tools.
How to Measure Core Web Vitals in WordPress
There isn’t one Core Web Vitals tool that does everything best. You may want a quick free score, test conditions closer to your audience, monitor hundreds of URLs, or investigate a specific performance problem.
Here’s which tool to use depending on what you need.
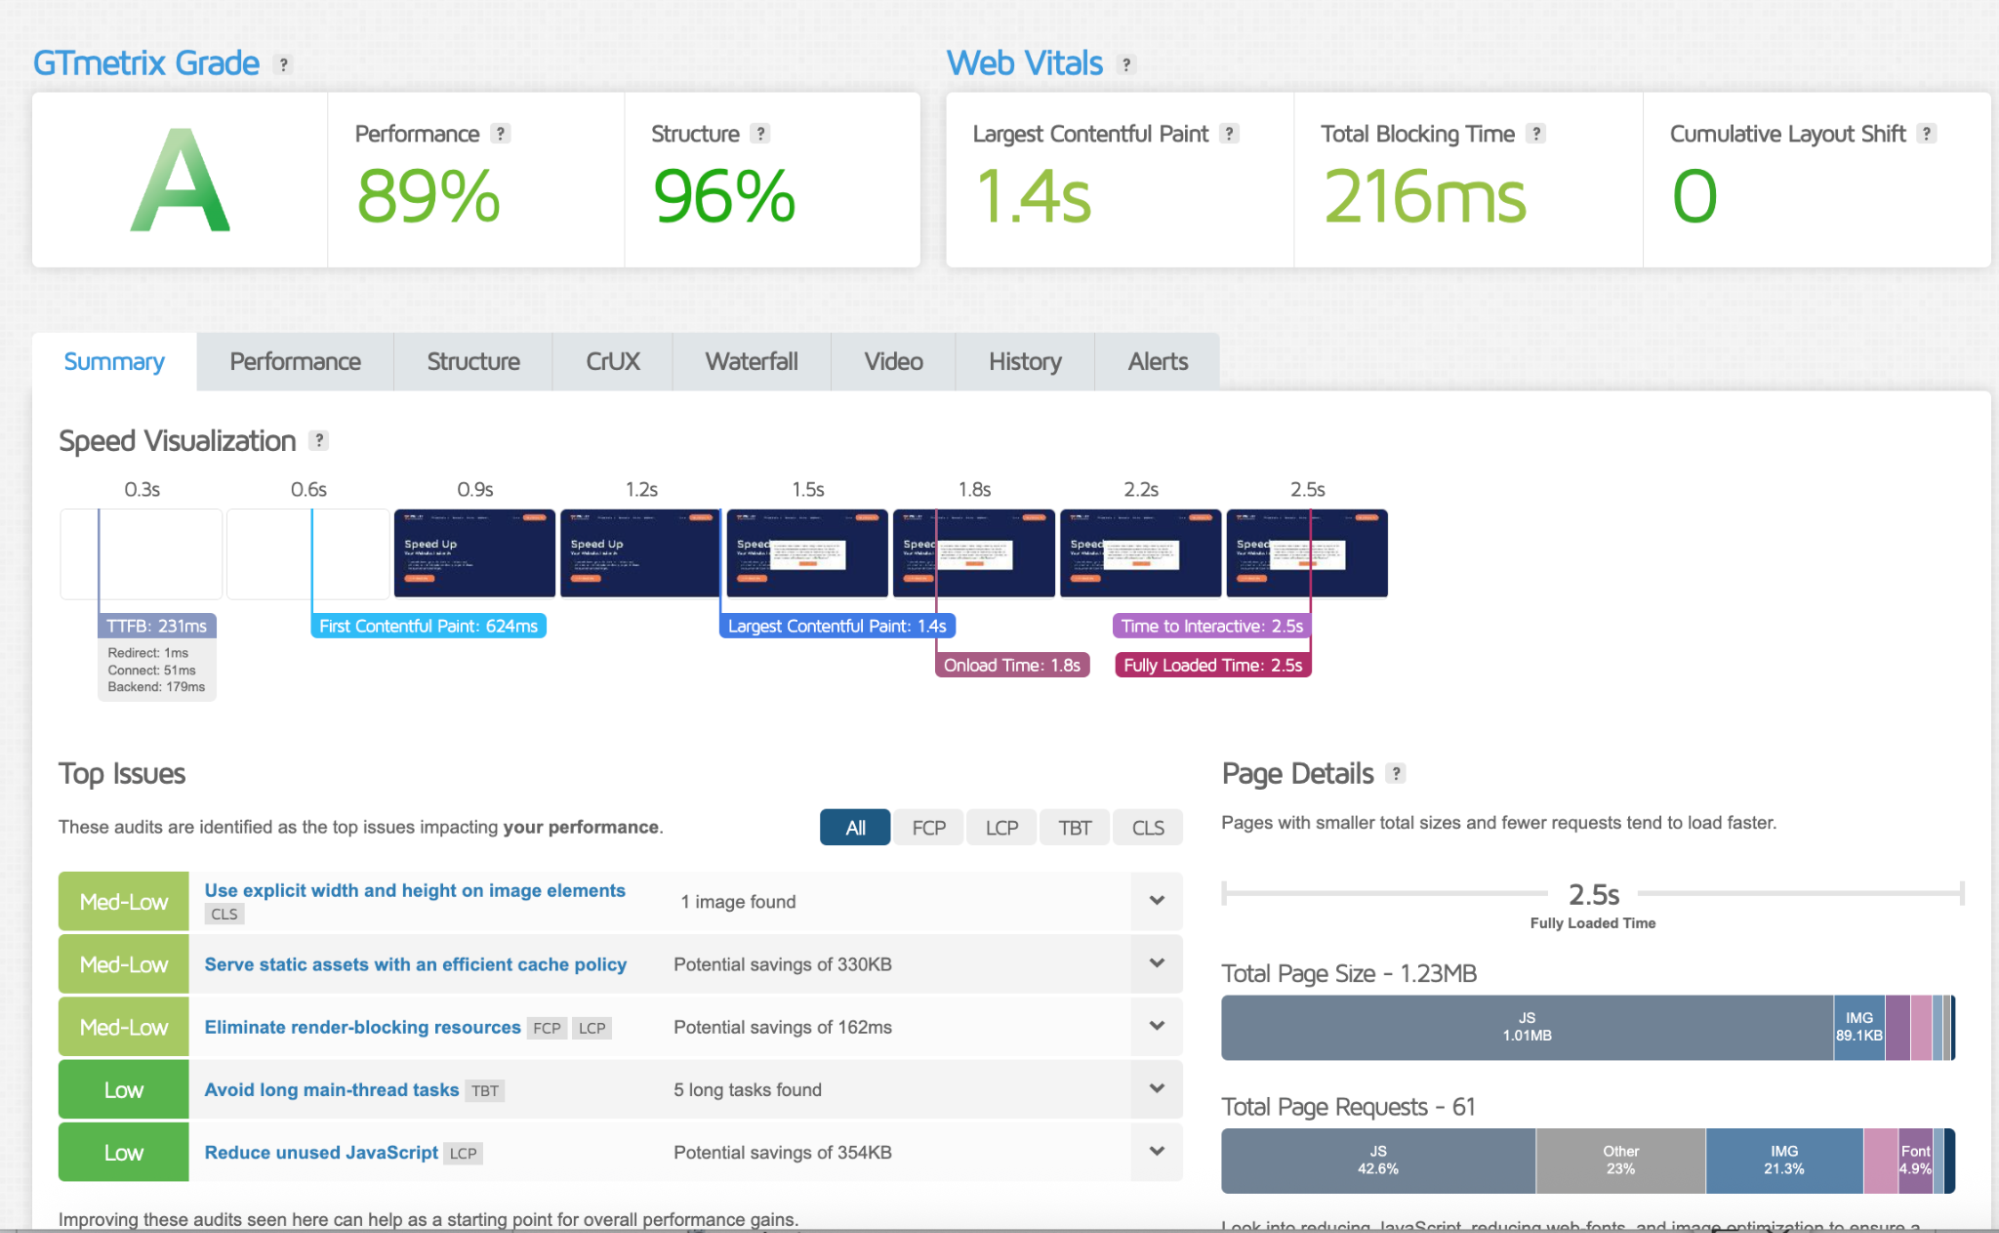
GTmetrix: Best for In-depth Performance Analysis
🎯 Purpose: Understand why your WordPress page is slow and test it under conditions closer to your real audience. Use GTmetrix when you want deeper, actionable analysis that remains easy to understand. It works particularly well for WordPress site owners, freelancers, agencies, and developers.
⚙️ Main features:
- Custom test location, device, browser, and connection speed.
- Breakdown of images, CSS, JavaScript, fonts, video, and third-party resources.
- Waterfall chart showing every request and its loading order.
- Video recording showing how the page loads.
- Performance history, monitoring and alerts setup.
GTmetrix can help you reproduce conditions closer to your actual visitors. If many customers browse your WooCommerce store from London on mobile, for example, you can test from London using a mobile device and a realistic connection speed.
It also makes page weight much easier to understand by showing how much comes from images, CSS, JavaScript, fonts, video, and other resources. The Waterfall goes one step further by showing what loads, when it loads, and how long each request takes.
🔎 Example: Your LCP is poor. Instead of stopping at the score, GTmetrix may reveal that a large hero image is loading late after several CSS files and third-party scripts. You now know where to start optimizing.
❌ Limitations: GTmetrix tests are mainly lab-based, even when you configure them to resemble your audience. Some locations, devices, and advanced testing options also require a paid plan.
PageSpeed Insights: Best for a Quick, Free Performance Check
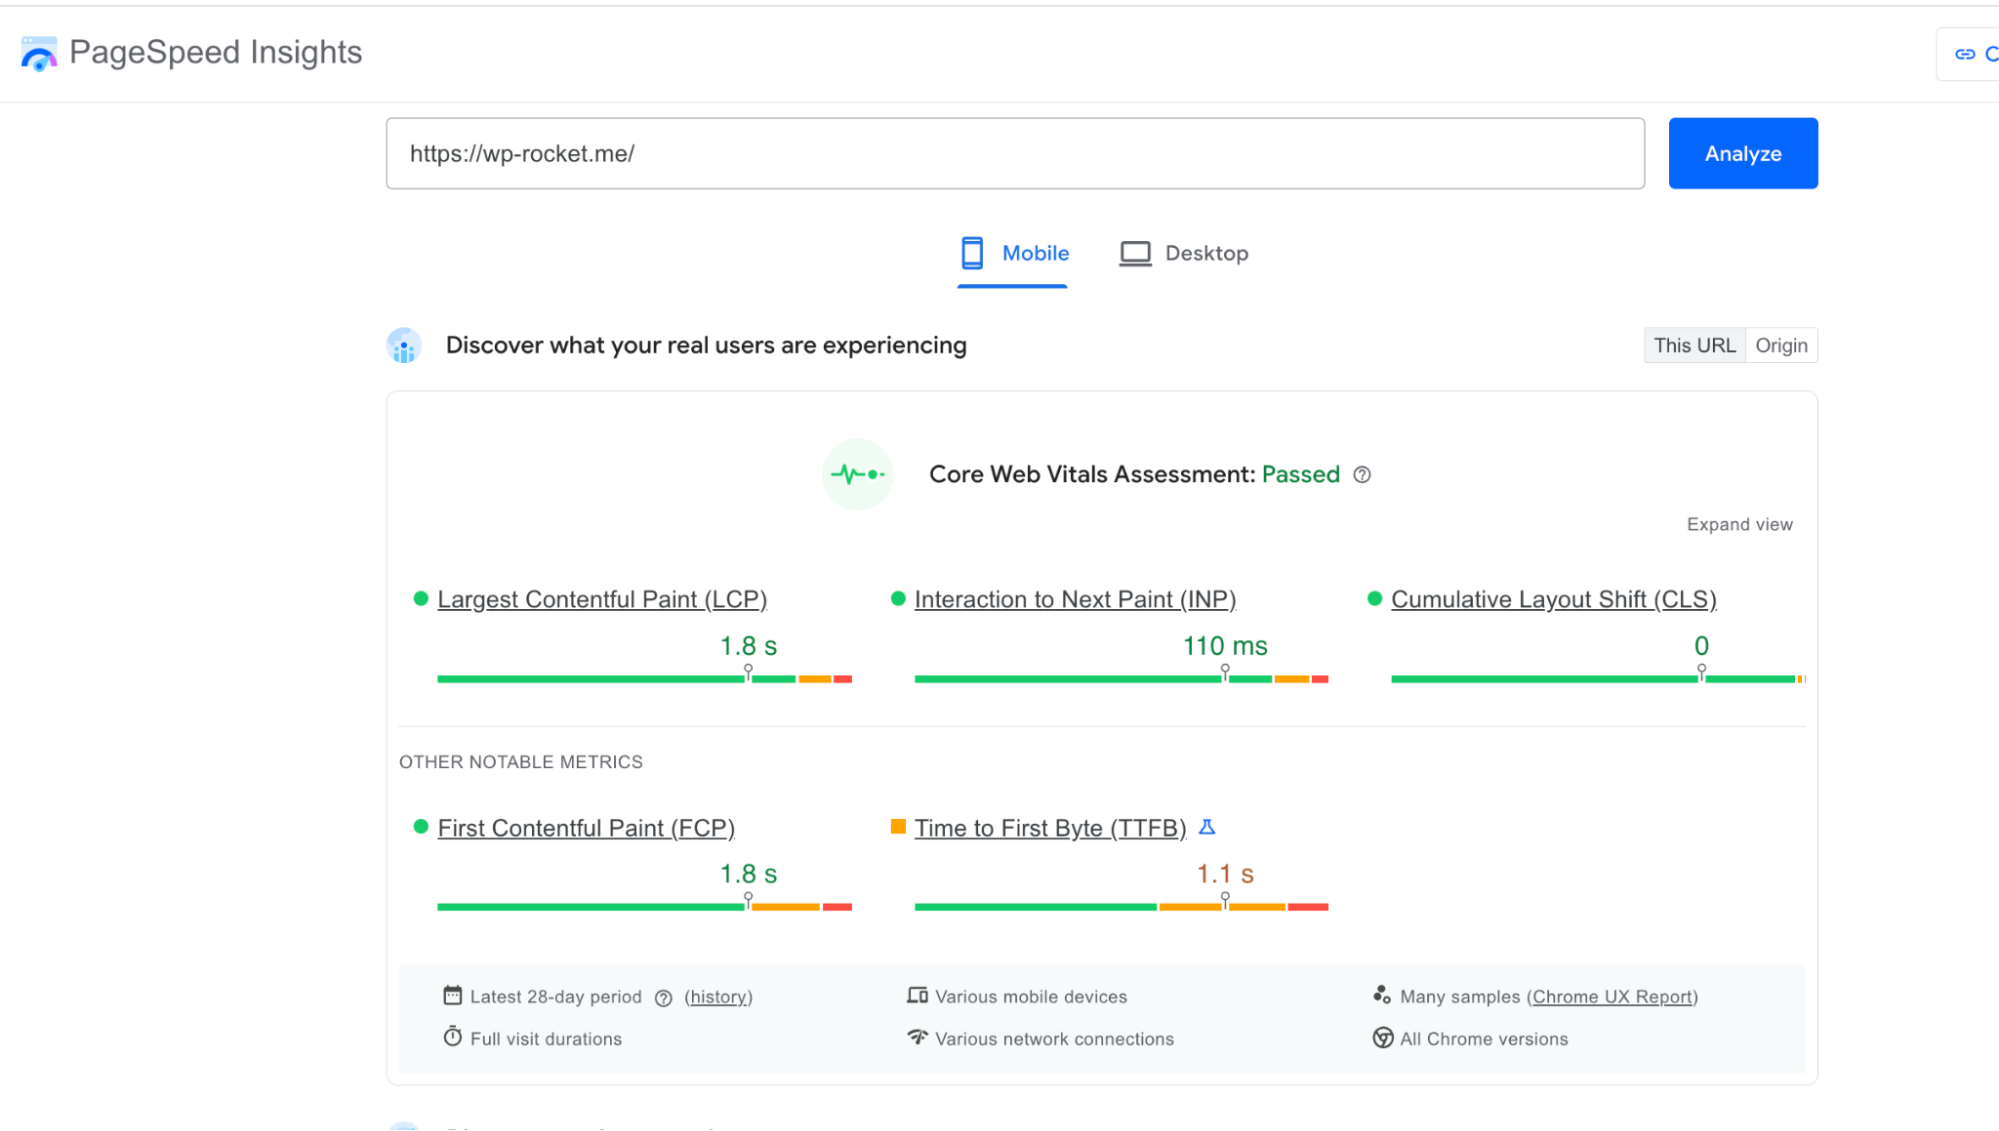
🎯 Purpose: Get a quick overview of your WordPress performance without configuring anything. Use PageSpeed Insights when you want a simple, free first check before moving on to deeper analysis.
⚙️ Main features:
- Free and easy to use.
- Lighthouse Performance score from 0 to 100.
- Simple green, orange, and red indicators.
- Separate mobile and desktop results.
- Core Web Vitals field data and optimization recommendations when available.
The Performance score makes the first diagnosis particularly easy:
- Green: 90 to 100.
- Orange: 50 to 89.
- Red: 0 to 49.
🔎 Example: Test your homepage or WooCommerce product page to quickly see whether performance looks healthy and which areas may require attention.
Keep in mind that the 0-100 Performance score and your Core Web Vitals assessment are not the same thing. The Performance score comes from a Lighthouse lab test, while the Core Web Vitals assessment uses real-user field data when available.
❌ Limitations: You have little control over the test conditions. You can compare mobile and desktop, but you cannot select a specific location, device, browser, or connection speed. The diagnosis is also less detailed than GTmetrix.
Google Search Console: Best for Core Web Vitals Across Multiple URLs
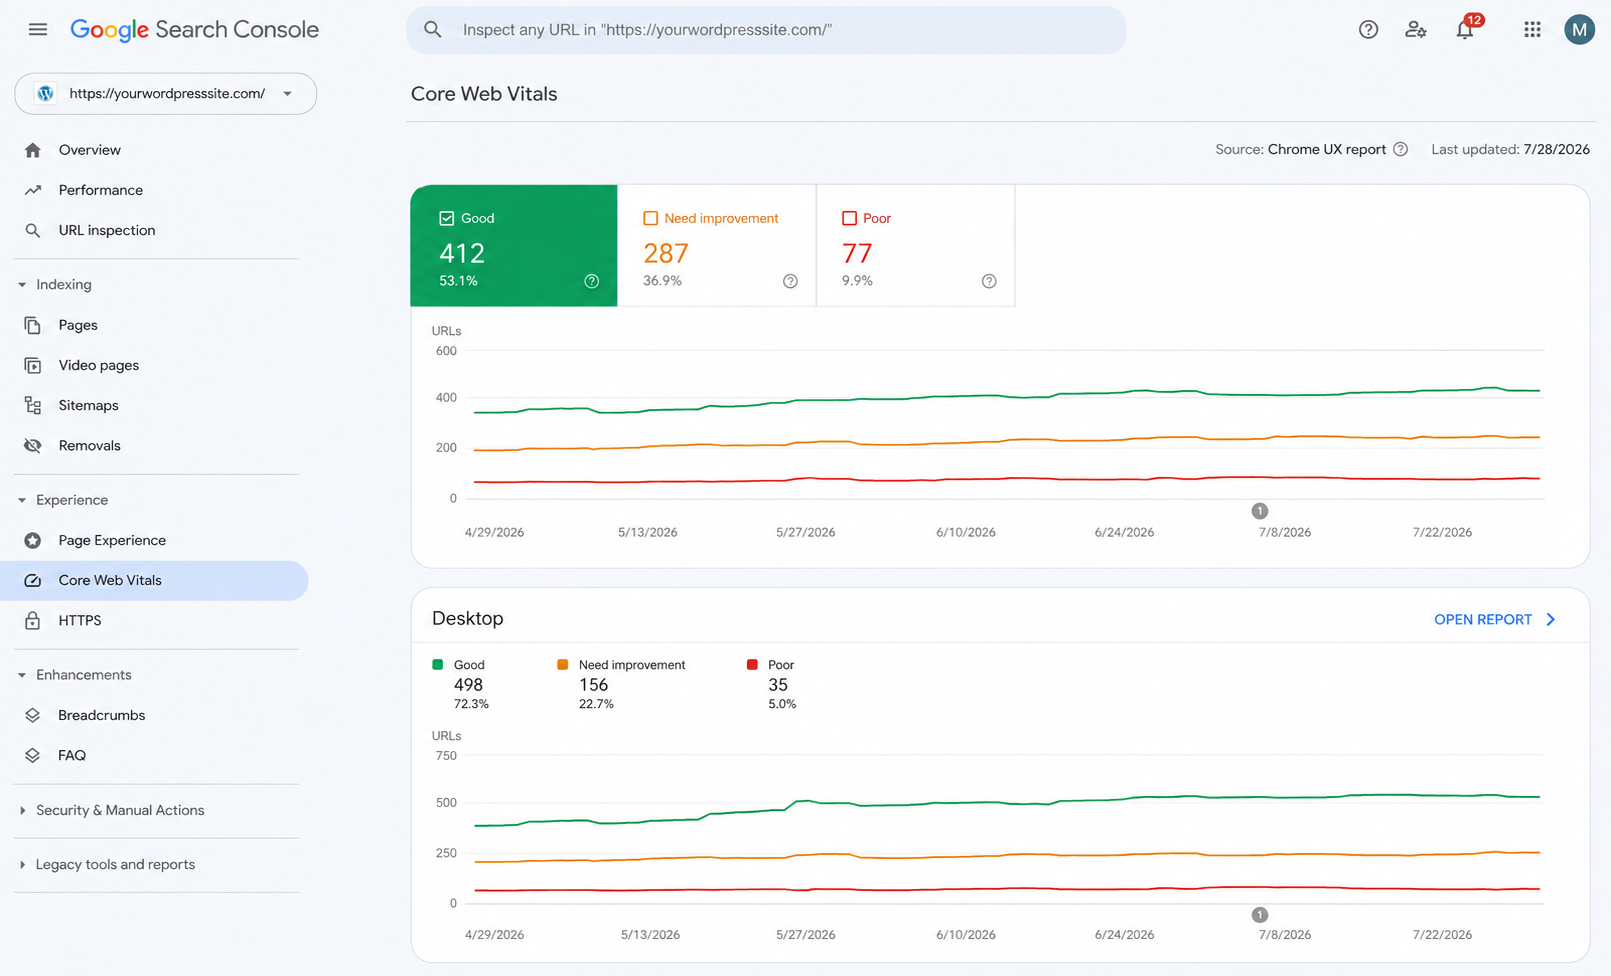
🎯 Purpose: Find out whether Core Web Vitals problems affect one page or entire groups of WordPress URLs. Use Search Console when you want to monitor real-user performance across your site and prioritize the page groups that need attention.
⚙️ Main features:
- Real-user field data.
- Separate mobile and desktop reports.
- Good, Needs Improvement, and Poor URL groups.
- Similar URLs grouped by Core Web Vitals issue.
- Monitoring and validation after a fix.
This is especially useful for WordPress because many pages share the same template. An issue affecting one product page, blog post, or category page may actually affect hundreds of similar URLs.
🔎 Example: Search Console reports poor LCP across 150 WooCommerce product pages. Instead of testing all 150 individually, you can investigate a few representative URLs and look for a common issue in the product template.
❌ Limitations: Search Console tells you where a problem exists, but not exactly what is causing it. Once you identify an affected URL group, use a diagnostic tool such as GTmetrix to investigate representative pages.
Lighthouse: Best for Controlled Before-and-After Testing
🎯 Purpose: Test your WordPress page under standardized conditions and see whether your optimizations improve performance. Use Lighthouse when you want to compare performance before and after making changes to your site.
⚙️ Main features:
Lighthouse is Google’s open-source auditing technology. It powers the lab analysis used by tools such as PageSpeed Insights and GTmetrix. Unlike PSI or GTmetrix, it is not primarily a standalone website, but an auditing engine you can run through Chrome DevTools or other interfaces.
❌ Limitations: Lighthouse provides simulated lab data, not the experience of your actual audience. Its Performance score should not be confused with your real-user Core Web Vitals assessment.
Chrome DevTools: Best for Instant Performance Testing in Chrome
🎯 Purpose: Inspect performance directly in Chrome while your WordPress page loads and responds to your actions. Use Chrome DevTools when you want to reproduce a specific problem and see what the browser is doing at that exact moment.
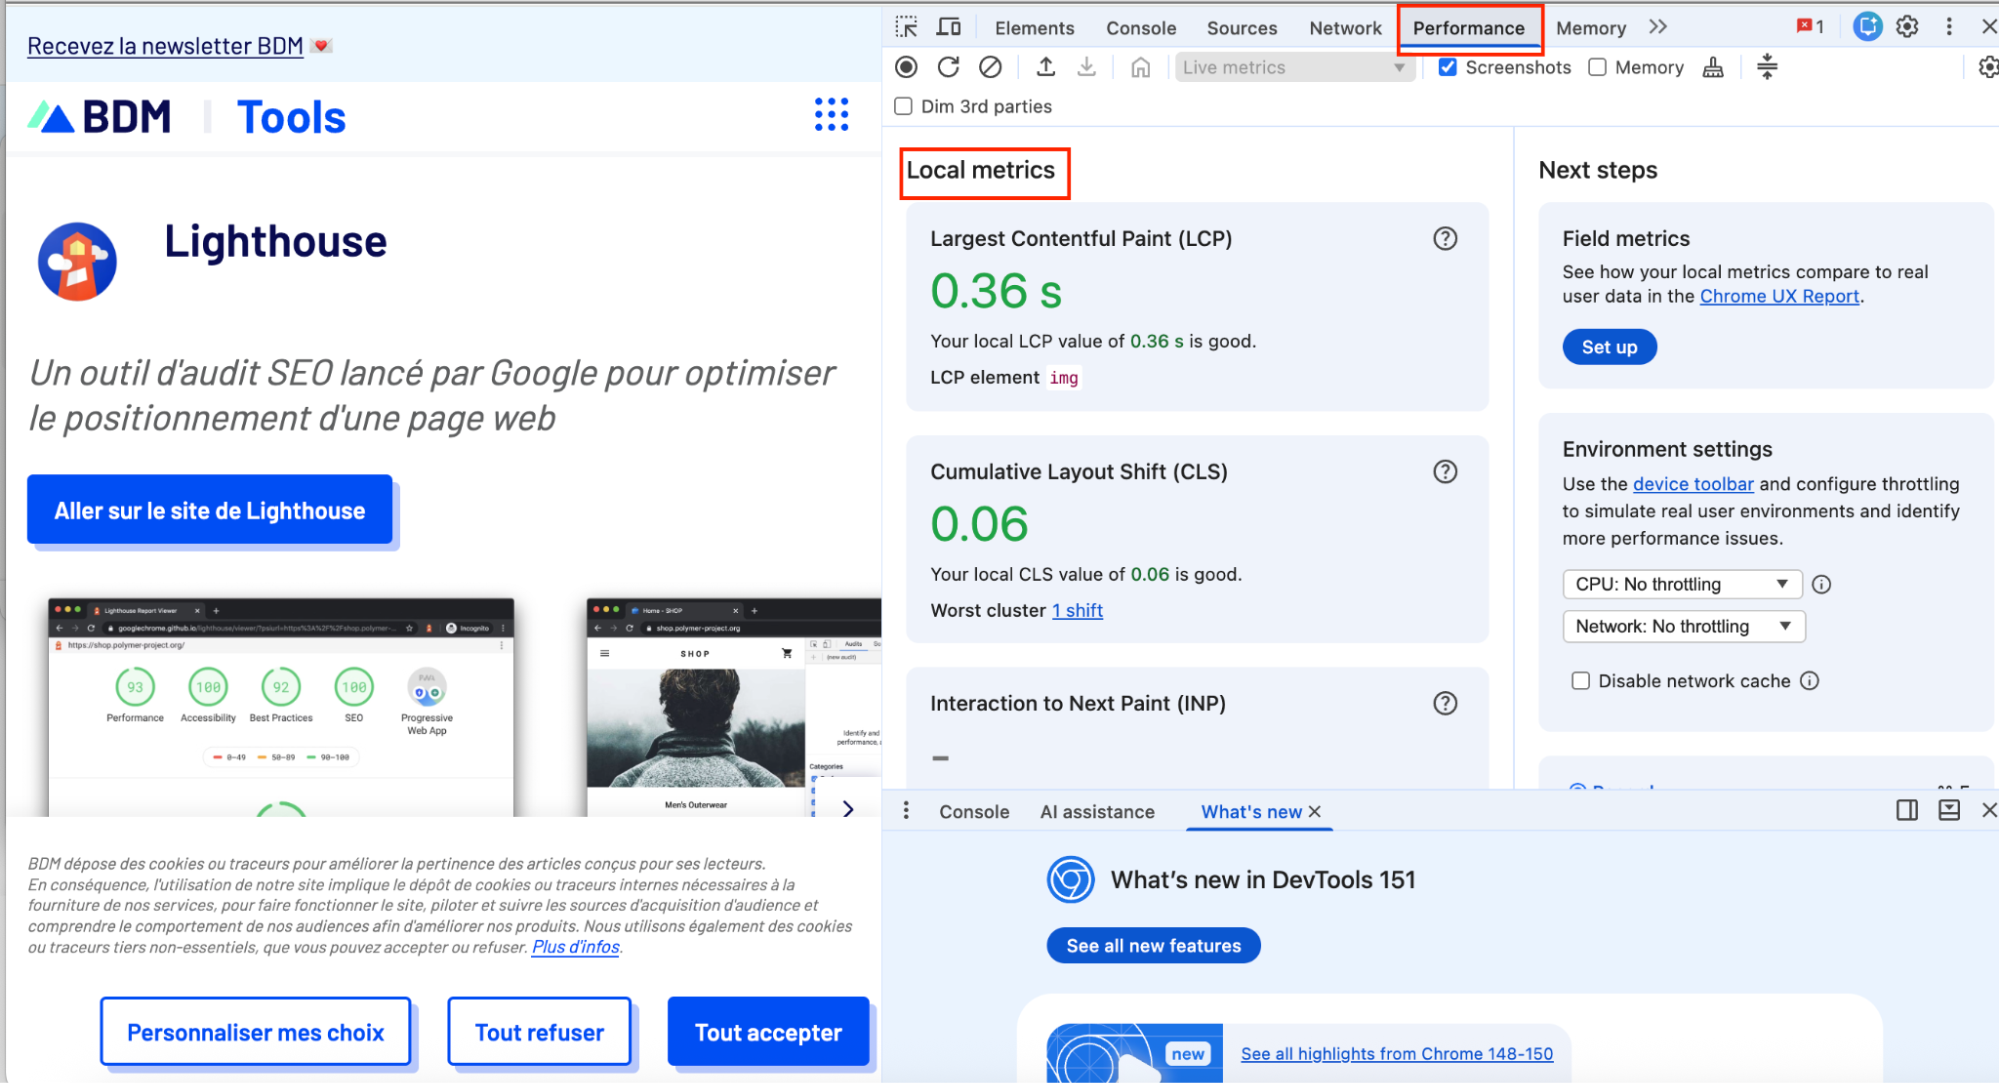
⚙️ Main features:
- Free and built directly into Chrome.
- Inspect LCP elements and CLS layout shifts.
- Record interactions to investigate responsiveness.
- Analyze JavaScript and main-thread activity.
- Inspect network requests, file sizes, timing, priorities, and caching.
Unlike GTmetrix, which organizes performance information into an easier-to-read report, DevTools gives you direct access to what is happening inside the browser.
🔎 Example: A WooCommerce filter feels slow. You can record yourself clicking it in DevTools and inspect what happens during that interaction, from JavaScript execution to main-thread activity.
❌ Limitations: DevTools is more technical and can feel overwhelming if you are not familiar with browser debugging. Results also reflect your own environment unless you configure network and device throttling.
Which Tool Is Best for Testing WordPress Core Web Vitals?
For a quick free check, start with PageSpeed Insights. If you want to understand what is actually slowing down a page, GTmetrix gives you deeper and more actionable insights. Search Console helps you spot problems affecting multiple URLs, Lighthouse is useful for testing the impact of your optimizations, and Chrome DevTools lets you investigate a specific issue directly inside the browser.
Use this quick decision-making table to match your goal with the right Core Web Vitals tool:
| Tool | Best For | What It Does Best |
| GTmetrix | Deeper performance analysis with clear, easy-to-understand reports | Custom test conditions, resource breakdown, video, and Waterfall |
| PageSpeed Insights | Quick, free first check | Easy 0-100 score plus Core Web Vitals data |
| Google Search Console | Monitoring many WordPress URLs | Real-user performance across groups of URLs |
| Lighthouse | Controlled before-and-after testing | Seeing whether your optimizations improve lab performance |
| Chrome DevTools | Instant testing directly in Chrome | Inspecting performance live while using the page |
What Should You Do Next to Improve Core Web Vitals in WordPress?
Once you know which Core Web Vital needs attention, the next step is to fix the issue, retest your WordPress site, and keep monitoring performance over time.
Let’s go over each type of issue and what you can do to fix it.
Your Main Content Loads Too Slowly
✅ Solution: time, Start with the LCP element — usually a large image or hero section — because it is the main content Google measures for this metric. If it is an image, compress it, use the right dimensions, and make sure it loads with high priority. Then improve server response time by implementing caching, choosing a reliable hosting, or a CDN if you have international audience. Reduce CSS or JavaScript that delays the main content from appearing.
Clicks or Interactions Feel Slow
✅ Solution: Improve INP by reducing the amount of JavaScript your page has to process. Remove unnecessary scripts and plugins, delay non-essential JavaScript, and break up heavy tasks when possible. This helps reduce long tasks and main-thread work, so the browser can respond faster when a visitor clicks, taps, or types.
Content Jumps Around While the Page Loads
✅ Solution: Improve CLS by setting image dimensions, optimizing font loading, and reserving space for ads, embeds, and dynamic content.
The Same Issue Affects Many Pages
✅ Solution: Use Google Search Console to identify affected URL groups and look for a common cause in your theme, plugins, templates, or content.
Lab Tests Look Good but Real-User Data Is Poor
✅ Solution: Prioritize field data and use GTmetrix to test conditions closer to your visitors, such as location, device, and connection speed.
You’ve Applied Your Fixes
✅ Solution: Retest under the same conditions to see what actually improved.
If you want to simplify the optimization process, include a performance plugin in your stack to save yourself some time and effort. For instance, upon activation WP Rocket applies around 80% of web performance best practices automatically, reducing the amount of manual configuration required.
| 🔁 Performance Workflow: Test, diagnose, optimize, retest, and monitor. As your WordPress site evolves, keep checking your Core Web Vitals to make sure new content, plugins, or scripts do not hurt performance. |
Frequently Asked Questions About Core Web Vitals
What Are Core Web Vitals in WordPress?
Core Web Vitals are Google metrics that measure how fast, responsive, and visually stable your WordPress site feels to real visitors. They include Largest Contentful Paint (LCP), Interaction to Next Paint (INP), and Cumulative Layout Shift (CLS).
What Is a Good Core Web Vitals Score?
A good score means LCP is within 2.5 seconds, INP is within 200 milliseconds, and CLS is 0.1 or less. For evaluation, Google mainly relies on real-user field data.
Why Do PageSpeed Insights and Search Console Show Different Results?
PageSpeed Insights focuses on one URL and combines lab testing with real-user data when available. Search Console uses field data collected over time and groups similar URLs, so the results can differ even for the same site.
Which Core Web Vital Should I Fix First?
Start with the problem your visitors are most likely to notice. Test your site with GTmetrix or PageSpeed Insights, then fix LCP if the main content loads slowly, INP if clicks or taps feel delayed, and CLS if elements move unexpectedly while the page loads.
Can a Caching Plugin Fix Core Web Vitals on Its Own?
Caching helps, especially for LCP, but it’s only part of the solution. Core Web Vitals can also be affected by images, CSS, JavaScript, fonts, layout shifts, and third-party scripts. For a more complete approach, use a performance plugin like WP Rocket. It goes beyond caching with features that optimize CSS and JavaScript, images, rendering, and other key areas that can affect LCP, INP, and CLS.
Wrapping Up
Always start with your data. Test your WordPress site, identify which Core Web Vital is failing, and focus on the issue behind it, whether that’s loading performance, responsiveness, or layout stability.
By now, you know what LCP, INP, and CLS measure, how to test them, which tools to use, and what to do when a score needs improvement. The final step is making those optimizations easier to manage over time.
So, how is your WordPress site performing? Try WP Rocket, retest your Core Web Vitals, and see what changes. With a 14-day money-back guarantee, you can give it a proper try without taking a big risk.