Table of Contents
Interaction to Next Paint (INP) is a webpage responsiveness metric measuring the latency of all user interactions on a page. Optimizing your website’s INP metric plays a crucial role in its speed, user experience, and SEO.
Announced in 2022 as an experimental metric to address many limitations of the First Input Delay (FID) metric, Google decided to replace FID as a Core Web Vital metric in March 2024.
This post will explore the basics of INP, why it is replacing FID, and how you can measure and improve your site’s INP metric.
Excited? Let’s go!
Importance of Measuring Webpage Responsiveness
No one likes a slow website (including Google!). And nothing shoves users away from your website faster than a slow website.
Metrics like Largest Contentful Paint (LCP) are a great indicator of page load speed—which is why it’s a Core Web Vitals metric.
But what happens after the page loads and the user sticks around? LCP doesn’t measure a page’s interactivity. As per Google, users spend 90% of their time on a page after it loads. Hence, measuring page responsiveness throughout its lifecycle—from opening to closing—is critical.
A website with fast page load speed but poor responsiveness is still a slow website—the result is a bad user experience. For example, taking a long time to open a mobile navigation menu or updating items in your online shopping cart.
That’s where measuring webpage responsiveness comes in. Websites with good responsiveness respond swiftly to user interactions. And this response has to be in the form of visual feedback.
Even for complex interactions requiring a longer time, presenting the user with some visual cue (e.g. a loading animation) is super important to maintain a stellar user experience.
Interaction to Next Paint (INP) vs. First Input Delay (FID): What’s The Difference?
Measuring a webpage’s user experience is quite tricky. You can use metrics like Total Blocking Time (TBT) and Time To Interactive (TTI) to get an idea of a page’s responsiveness, but they don’t indicate actual user experience.
For instance, a page can have fast TBT or TTI and still feel sluggish for the user because of how they interact with it. The same holds in reverse.
Enter FID—it directly measures a user’s first interaction on a webpage. Specifically, it measures real user experience in the field.
First Input Delay (FID) Limitations
As its name implies, FID only measures the “delay” in a browser’s response to the “first input.”
In short, it’s a page load responsiveness metric—how quickly the JavaScript code loads and executes—not a runtime responsiveness metric—how quickly the page responds to user interactions after page load.
While first impressions matter, they don’t necessarily give a full picture! FID improved how we measure webpage responsiveness, but it doesn’t accurately measure how users interact with a webpage—from opening to closing a webpage.
For instance, FID doesn’t measure the time taken to run event handlers on delays in presenting the next frame.
What’s Interaction to Next Paint (INP)?
INP measures a page’s overall responsiveness to user interactions—clicks, taps, keypresses, etc.
An interaction can include multiple group handlers. For instance, tapping your phone’s touchscreen can start a chain of events in the page’s background. Either way, INP is the page’s longest latency from when the user starts the interaction to when the browser presents the next frame with visual feedback.
Unlike FID, which only measures the time taken for a browser to respond to a user’s first interaction, INP observes all user interactions on a page and provides an overall score.
As such, INP goes beyond first impressions and samples all user interactions, making it a more reliable indicator of page responsiveness.
Just like with FID, a low INP score means better page responsiveness to user inputs.
How Is INP Calculated?
For most websites, the final INP metric is the longest interaction. However, some outliers exist.
For instance, if your webpage has mostly text and images, it won’t have many user interactions. But if it’s a dynamic page with many interactive elements (e.g. text editors and games), it’ll have numerous interactions. In such cases, a random delay can setback the page’s INP score on an otherwise highly responsive site. To overcome this, INP ignores one highest interaction for every 50 user interactions.
Most pages have way fewer interactions than 50, so that shouldn’t be a concern. Plus, INP only takes into account the 75th percentile of all the page views, further removing unexpected outliers.
Ultimately, the final INP score is a reflection of what most users experience.
Note: INP doesn’t take into account hovering and scrolling actions. However, scrolling with your keyboard may trigger events measured by INP. Either way, page scrolling isn’t measured by INP. If a user doesn’t interact with the page, it’s also possible for that page load to return no INP score.
What’s a Good INP Score?
Users may be browsing websites on a variety of devices. And each website can be unique. Hence, it’s hard to label a website’s responsiveness “good” or “poor” based on a single metric. But that’s precisely what INP aims to achieve.
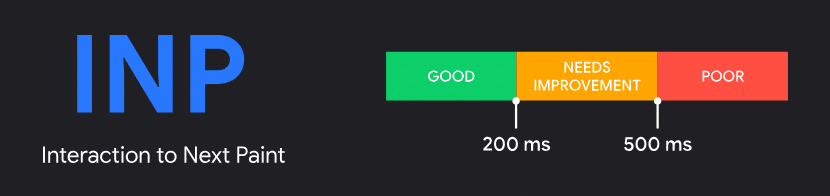
Google has an easy chart to ascertain whether your site has a good or poor INP score:
- Good responsiveness: An INP score below 200 milliseconds.
- Needs improvement: An INP score between 200 and 500 milliseconds.
- Poor responsiveness: An INP score above 500 milliseconds.
As mentioned earlier, INP considers the 75th percentile of all recorded page loads, spread across desktop and mobile devices.
How To Measure INP
You can measure INP both in the field (data from actual users) and in the lab (data from speed test tools).
Measuring INP In the Field
There are two ways to measure INP in the field: Chrome User Experience Report (CrUX) and Real User Monitoring (RUM).
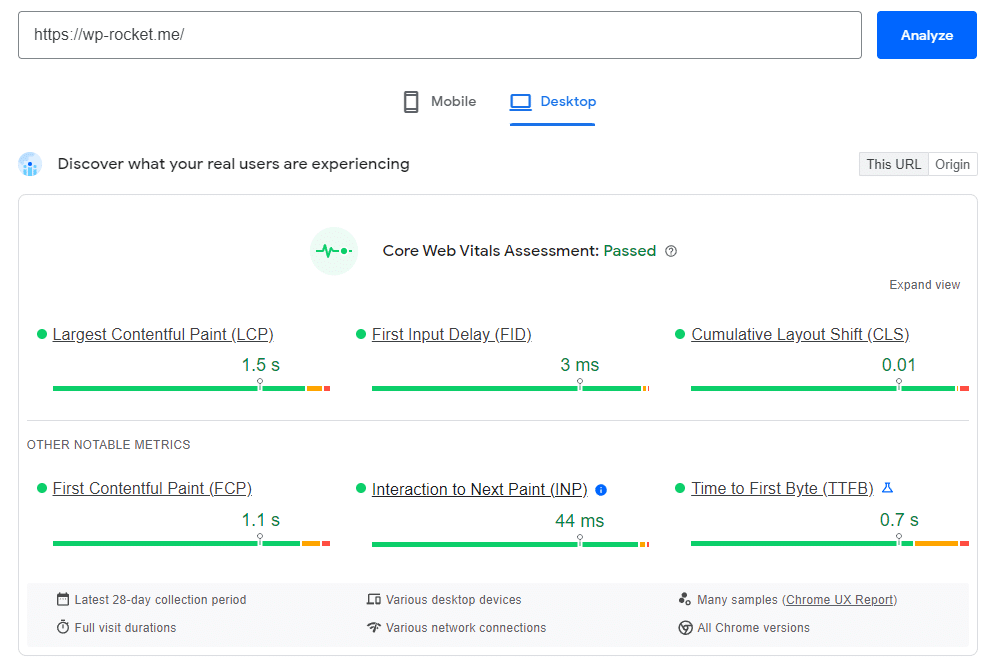
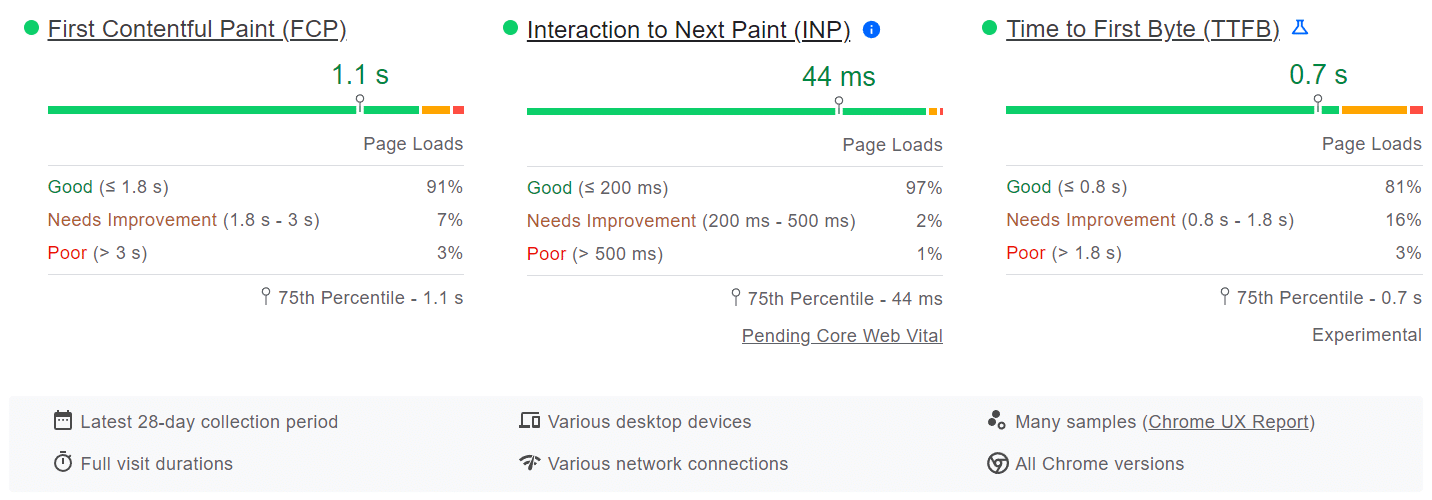
CrUX data is collected from Chrome browser users who have opted in. If your website qualifies for CrUX evaluation, you can measure its INP using Google’s PageSpeed Insights speed testing tool.
Google uses CrUX as its official dataset to evaluate websites for its Core Web Vitals program. However, if your website doesn’t qualify for CrUX for some reason (mainly, very few visitors), then you need to collect your own field data by adding code to your website. You can then feed this field data to a RUM provider for a deeper analysis.
For most websites, PageSpeed Insights is a good enough tool to measure INP and all related Core Web Vitals metrics.
However, CrUX doesn’t provide you with detailed information about its results. Investing in an RUM solution is recommended if you want to understand and improve your metrics further. Covering how to use these tools is beyond the scope of this article. You can check out DebugBear RUM, Datadog, and New Relic, which are some popular free RUM solutions.
Note: When measuring INP, you may find stark differences between data from the field and the lab. Ideally, you should gather metrics from the field as that gives you a measure of what actual users experience. You can then use this data to optimize your INP further. We’ll cover that in a later section.
Measuring INP Without Field Data
You cannot measure INP in the lab, but if you cannot measure field data for some reason—having very few site visitors to qualify for CrUX or you don’t have enough resources to invest in RUM—you can still improve your potential INP score by finding slow interactions in the lab.
Note: As mentioned above, measuring INP in the lab isn’t possible. The below suggestions only give you a rough picture of the actual INP metric. You can’t rely on lab measurements to predict field metrics like INP, as they don’t simulate how real users use your website accurately.
The Web Vitals Chrome browser extension is the simplest way to test the latency of user interactions. After enabling it, test your website’s typical interactions. The extension will output detailed diagnostic information for each interaction to the console.
After installing the extension, you need to identify common user interaction flows on your webpage and test the responsiveness of those interactions individually. For instance, submitting a form or adding an item to the cart. You can follow web.dev’s step-by-step instructions to get started. It’s not a perfect workaround, but in the absence of field data, it’s a great alternative.
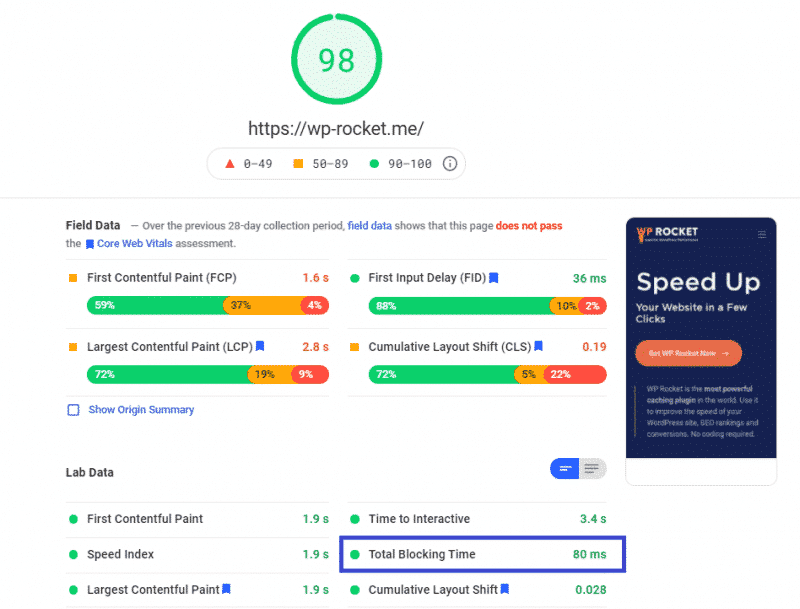
Another option is to measure your site’s Total Blocking Time (TBT) metric. It correlates pretty well with INP and can hint toward interactions you can focus on. Two great tools to measure your page’s TBT are Lighthouse and PageSpeed Insights.
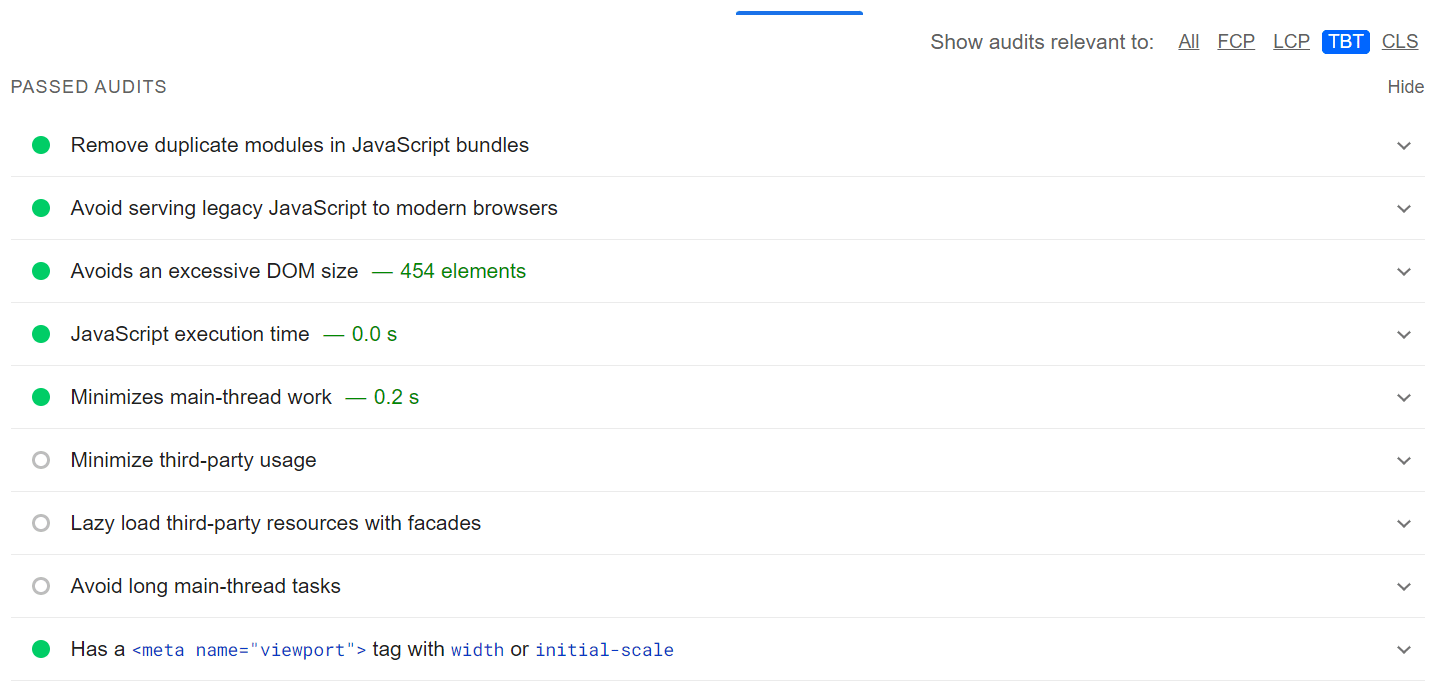
However, keep in mind that TBT doesn’t measure slow interactions after the page has loaded.
How To Optimize Interaction To Next Paint (INP)
The first step to improve your website’s INP is to identify its slowest interactions. The earlier section highlights how to collect field data to diagnose your website’s slowest interactions.
Once you’ve got that down, you can analyze these slow interactions in the lab and find a suitable solution.
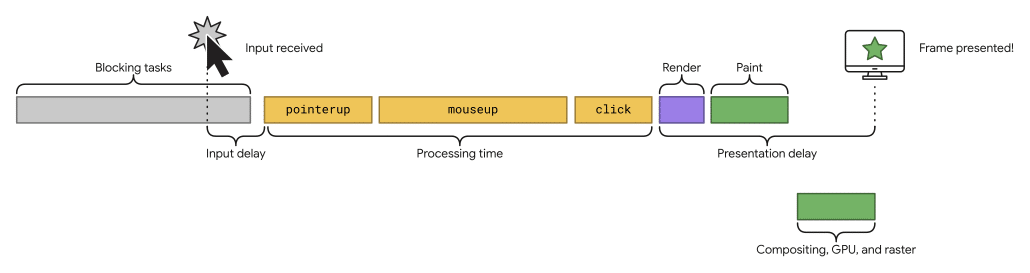
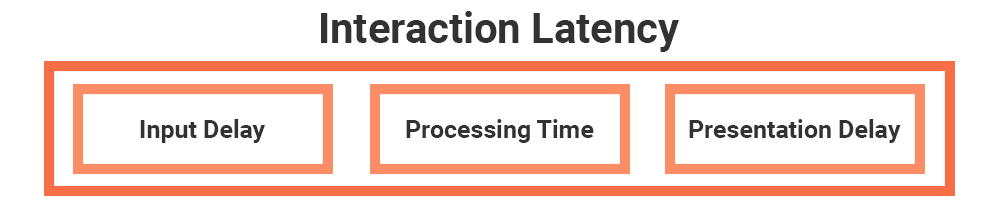
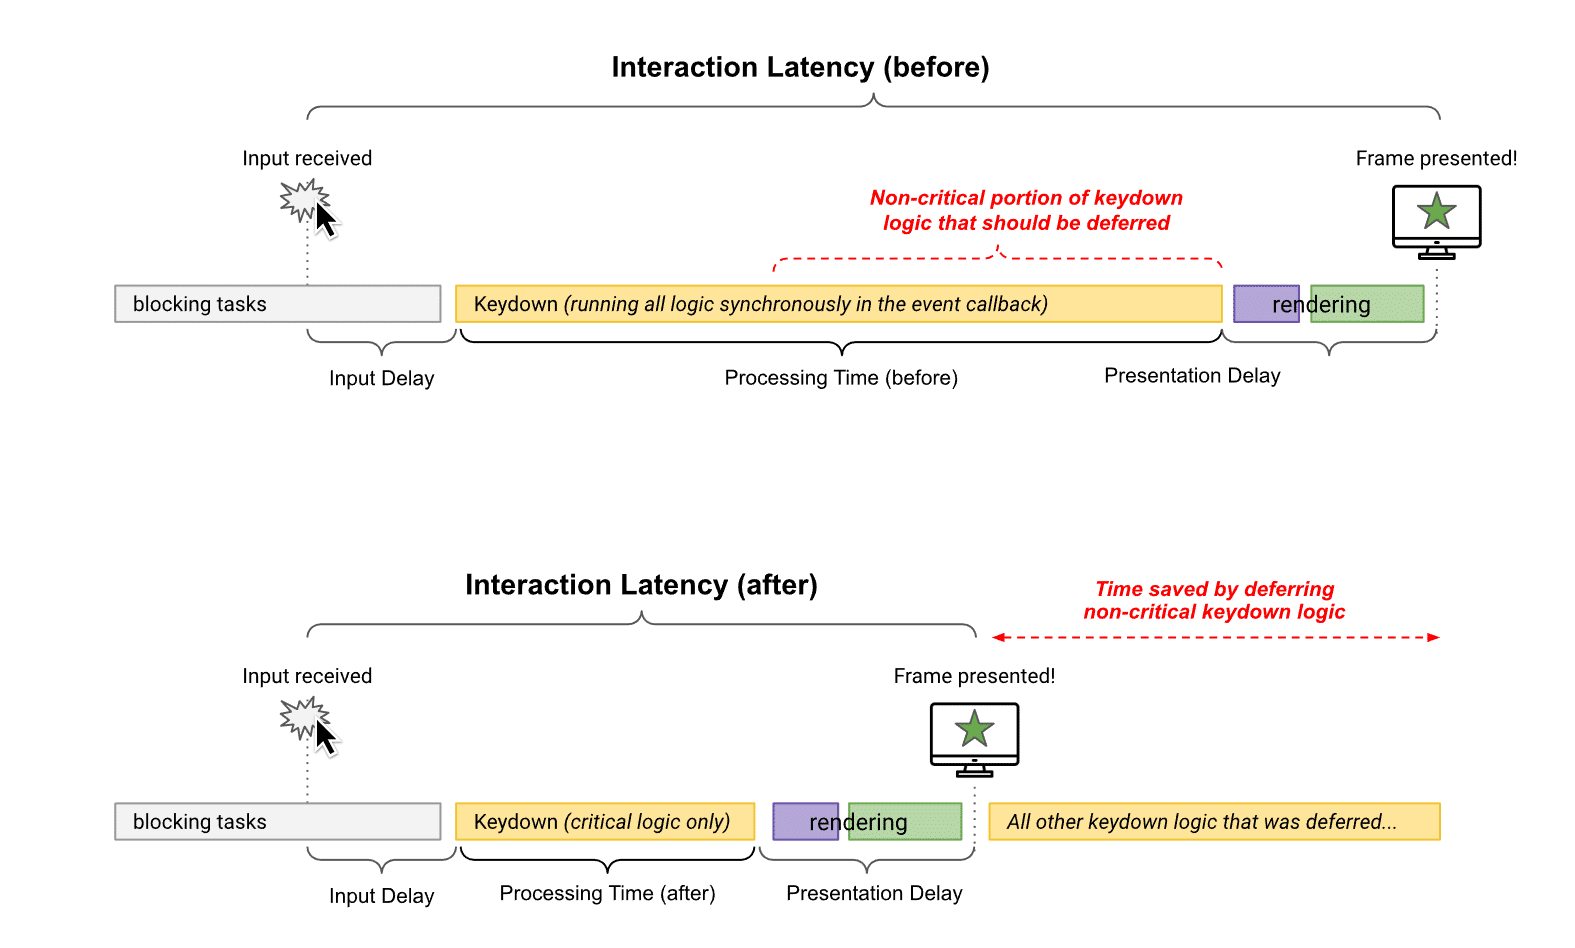
Every user interaction consists of three phases. You can look at these phases individually to figure out how to optimize the overall interaction latency.
- Input Delay: This starts when a user initiates an interaction and ends when the interaction’s event callback begins to run.
- Processing Time: The time taken for the event callbacks to complete.
- Presentation Delay: The time taken for the browser to update the next frame with visual feedback.
Every phase of a user interaction contributes to the final interaction latency, and thus the INP score. Knowing how to optimize each phase is key to speed up responsiveness.
Optimizing Input Delay
Input delay is the first part of any user interaction. Anyone who plays videogames knows how frustrating it is to have any input delay. The same applies to website interactions.
Based on the interaction, input delays can stretch from a few milliseconds to hundreds of milliseconds. This can be due to multiple reasons: busy main thread activity, errors, overlapping interactions, etc.
No matter the reason, you must keep input delay to a minimum so that the event callback can start running as soon as possible. Here are three ways you can reduce input delay:
- Reduce the number of resources a page requires to become fully functional.
- Avoid loading large scripts, as they’ll require resource-heavy script evaluation by the browser, blocking the main thread. Consider breaking down your scripts into multiple chunks and spreading them out.
- Include as little JavaScript in your code as possible.
Reducing Event Callback Processing Time
The next part of optimizing your INP score involves reducing the time taken to process an interaction’s event callbacks.
Apart from optimizing the event callback’s code, there are some actions you can take to reduce processing time:
- Don’t block the main thread. Break up your long tasks (>50 ms) into smaller tasks.
- If you’re embedding something on your page, avoid loading them when they’re not used. For example, it’s not efficient to load YouTube videos if the user doesn’t intend to play them.
Here’s where WP Rocket, one of the best WordPress performance plugins, can help immensely. You can enable its Replace YouTube iframe with preview image feature to replace any YouTube iframe with a thumbnail image.
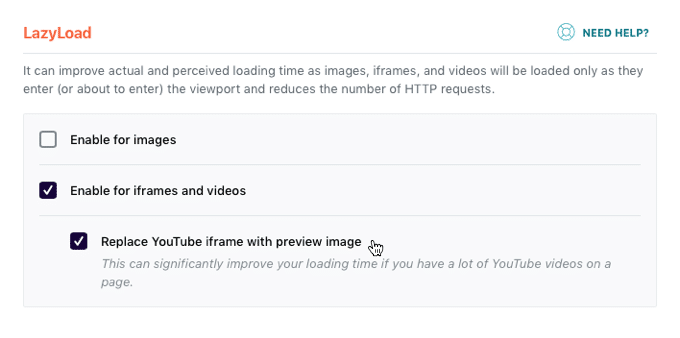
The iframe tag will load and play the video only after a visitor clicks the thumbnail. WP Rocket’s powerful features can boost your loading time and improve your Core Web Vitals.
- Avoid third-party scripts in your code. For third-party scripts that you do use, tools like Google Tag Manager or Cloudflare Zaraz can help you streamline loading these scripts.
- Defer unnecessary tasks to perform later asynchronously. You can enable this with WP Rocket’s built-in Load JavaScript deferred feature.
A webpage’s main thread can process only one task at a time inside the browser. The tasks can include activities such as parsing HTML/CSS, rendering the page, and running JS code. When a task runs for a long time (say, 50 milliseconds or more), it’ll hold back all the other tasks, including user interactions
In some instances, you may find a theme or plugin slowing down your main thread. As you don’t have much control over its code, you can reach out to the theme or plugin authors to find a suitable fix.
By breaking down your long tasks into smaller chunks, you free the main thread to take up high-priority tasks, which include user interactions. This results in a snappy website!
Minimizing Presentation Delay
The final part of user interaction is the presenting delay. It’s the time between finishing event callbacks and painting the next frame with visual feedback.
Typically, presentation delay takes up the least time for user interactions. However, it can be held back in several ways. Here are some ways to keep it to a minimum:
- Keep DOM size to a minimum. Page rendering tasks scale up or down depending on the DOM size. Updating a large DOM for every user interaction can become super expensive for the browser. Moreover, a large DOM requires more time to render a page’s first state. Refer to our handy DOM size guide for more details.
- Render off-screen elements lazily. If a large portion of your page content isn’t visible to the user on page load, rendering off-screen elements lazily can allow faster interactions with on-screen content. You can use the CSS content-visibility property to achieve this easily without adding any extra code or plugins.
- Avoid rendering HTML using JavaScript. Browsers parse and render HTML optimally to deliver the best user experience possible. Using JS to render parts of HTML is fine, and is an integral part of most user interactions. However, rendering large chunks of HTML with JS will impact your website’s rendering performance significantly, including presentation delays for user interactions.
Boosting Your Website’s INP Score with WP Rocket
WP Rocket includes many options to provide immediate performance benefits to your website. From automatically enabling page caching and cache preloading to GZIP compression and eCommerce optimization, it applies 80% of web performance best practices to get your website running blazing fast right upon activation!
Besides applying most web performance best practices upon activation, WP Rocket offers powerful features such as lazy loading, removing unused CSS, and optimizing JavaScript.
Most importantly, for optimizing INP, you can use WP Rocket’s built-in feature to delay the execution of JS scripts till user interaction. This reduces initial page load time and betters interactivity. It also impacts the other Core Web Vitals metrics – the Largest Contentful Paint (LCP) and the First Input Delay (FID).
Wrapping Up
With INP replacing FID as a Core Web Vital metric in March 2024, how your website handles user interactions can have a significant impact on its SEO.
If you have a highly interactive website, optimizing your site’s INP can seem like a neverending process. There’s always one more interaction to optimize. Adding new features only adds further to the burden. However, you have to start somewhere. This article has hopefully started you off on the right foot.
A better INP score also means better user experience, and that’s worth all the time and effort!