Table of Contents
Interaction to Next Paint (INP) is a Core Web Vitals metric that assesses the responsiveness of web pages by giving insight how quickly they respond to user interactions like clicking a button, opening a navigation menu, or adding a product to the online shopping cart.
It has been around since March 2024, when it replaced First Input Delay (FID). It is getting an update in October 2025 when Google moves over its speed testing tools, Lighthouse and PageSpeed Insights, to the new performance insight audits. The new INP insight will provide more detailed information about the causes of Interaction to Next Paint by looking at the different phases of user interactions.
To help you understand what that means, this article takes a detailed look at what the Interaction to Next Paint insight is, how to understand if it applies to your website, and how to improve it manually and via plugin. It’s a bit of a technical topic and can seem intimidating at first but we’ll do our best to break it down and make it as beginner-friendly as possible.
| TL;DR Do you have no time for the entire post right now? Here are the main points, just for you: ✅ Interaction to Next Paint (INP) measures how quickly your website responds to real user actions, like clicks or taps. It’s been a key Core Web Vital since 2024. ✅ In October 2025, Google is rolling out a new INP Insight in Lighthouse and PageSpeed Insights. It visualizes the three phases of page interactions—input delay, processing time, and presentation delay—in more detail so you can pinpoint what’s slowing things down. ✅ You can improve INP by optimizing JavaScript, avoiding excessive DOM size and changes, reducing layout shifts, and simplifying mobile layout. Chrome DevTools helps you test each interaction phase. ✅ If you use WordPress, WP Rocket can automate most fixes: optimizing and delaying JavaScript, lazy rendering, and more—all with just a few settings. |
What is the Interaction to Next Paint Insight?
As mentioned above, the INP Insight evaluates how quickly a web page responds to user input. To do that, it measures the reaction time of all interactions and presents the longest one.
A good INP score is especially important for websites with high user engagement, such as e-commerce, SaaS platforms, and content-heavy pages.
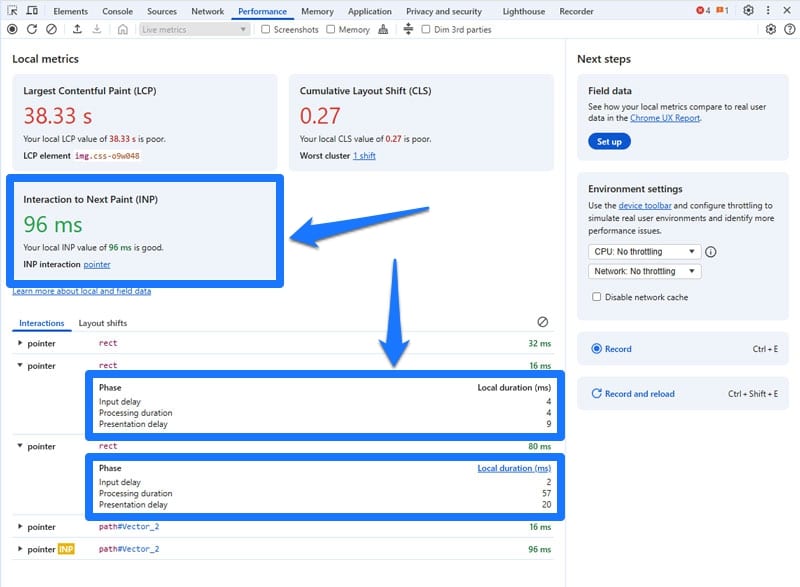
INP breaks down user interactions into three phases:
- Input delay: The time between when a user does something (like clicking a button) and when the browser starts working on a response.
- Processing time: How long the browser spends crunching JavaScript or other code to figure out what should happen next.
- Presentation delay (paint): The time it takes to visually show the result of the interaction on screen — like updating a list, opening a menu, or changing a style.
This was already part of the original metric from 2024. What’s new about the Interaction to Next Paint insight is that it provides more data for each phase, making it easier to determine where to put your efforts to improve it.
The new insight replaces an older audit called “work-during-interaction,” which evaluates how much main-thread activity happens while a user is interacting with a page. The main thread is the primary data stream in browsers for handling the work needed to display and interact with web pages.
How to Determine Interaction to Next Paint Is an Issue on Your Site
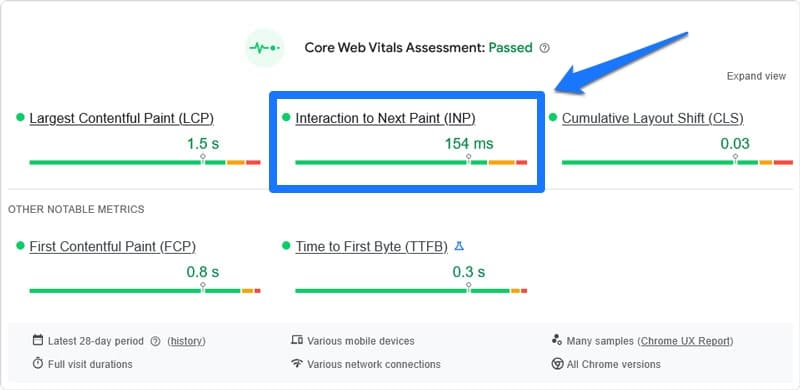
The first thing you need to know about Interaction to Next Paint is that it’s usually based on field data, not lab data. That’s why Google’s tools will only show it if they have data from real-world users, meaning the Chrome User Experience Report (CrUX).
If your site doesn’t have enough traffic for INP data to appear, an alternative is Real User Monitoring (RUM), e.g. with the web-vitals JavaScript library. It has the added benefit that it can also tell you what exact interaction increases your INP. Total Blocking Time (TBT) is also a good proxy to understand if your site responds slowly to user interactions.
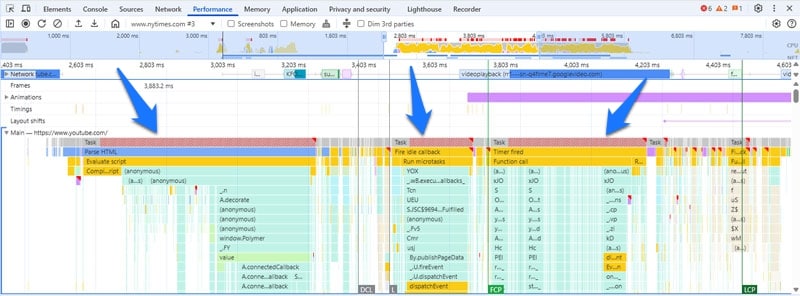
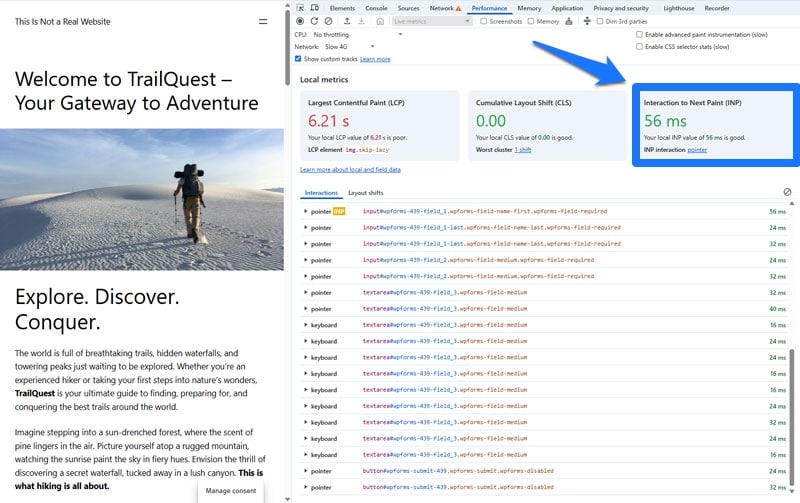
Besides that, another possibility is to produce lab data in Chrome developer tools. For that, open your website in Chrome and choose More tools > Developer Tools or press Ctrl/Cmd+Shift+I, then access the Performance tab.
Chrome automatically tracks performance data when you interact with a page and shows INP data as well as the three phases of any interaction.
Imitate common user behavior to get meaningful data by checking your analytics for how users move through your site.
You can also record a performance trace during which you use interactive elements on the page by clicking the Record button (or pressing Ctrl/Cmd+Shift+E). When you stop recording, the INP by phase insight and an overlay will show the phases as well.
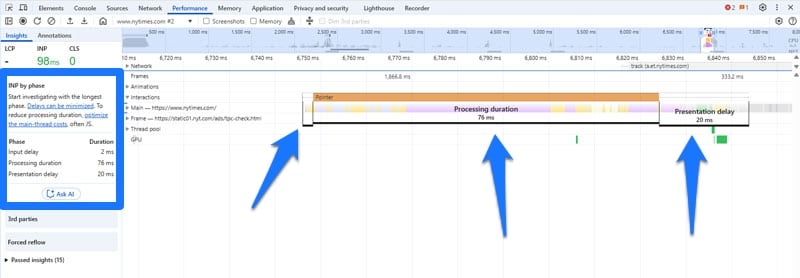
While it’s not the same as measuring the experience from many users, it’s still useful information to work with.
| 💡 For more information, check the detailed article on the Chrome for Developers blog. |
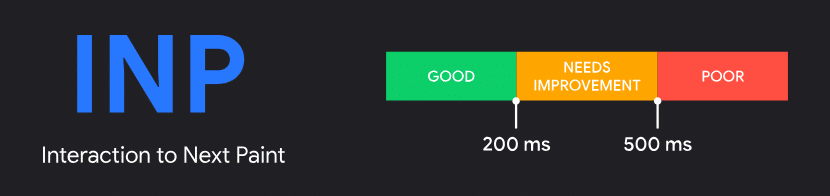
Ideally, you want an INP value of under 200ms. Google views up to 500ms as needing improvement and everything above that as a poor performance.
Improving Input Delay
If INP indicates that your site needs work, you can use its breakdown into phases to understand what part you need to optimize. Let’s discuss how to do that now starting with the first phase, input delay.
We’ll show you how to improve the Interaction to Next Paint insight by hand first, so you better understand the underlying mechanics. After that, we’ll also look at an option on how to do this more easily using a plugin (click here to jump directly to that section).
Optimize JavaScript Performance
Input delay often happens because the browser’s main thread is too busy to respond in time, frequently because it’s processing JavaScript. To keep it free for more important tasks, the first step is to optimize JavaScript handling on your site.
For one, that means only loading JavaScript when it’s actually needed. For example, you don’t need a form script on a page that doesn’t have a form on it.
A second step is to defer scripts that aren’t necessary for initial load and display. You can do that by moving them to the footer or adding defer and async attributes to their calls like this:
<script src="analytics.js" async></script>

 <script src="main.js" defer></script>

<script src="helper.js" defer></script>
Both cause JavaScript to download in the background though the way they function is slightly different.
| 💡 For more details, check our tutorials on how to defer JavaScript and how to add JavaScript to WordPress. |
Yield to the Main Thread
Next, for all JavaScript code that must load early, make sure to avoid long tasks. Those are JavaScript tasks that run continuously for more than 50ms, blocking the browser from responding to user interactions in the meantime.
You can identify long tasks in the Chrome developer tools Performance tab. They are shaded in red with a red triangle in the corner.
Break up long tasks into smaller chunks so the browser can handle user input in between. You can use functions like setTimeout() and requestIdleCallback() to do so. The scheduler.yield() API is another option though not currently supported by every browser.
Breaking up long tasks allows the browser to yield to the main thread and do other work instead of being stuck and potentially keeping visitors waiting.
How to Optimize Processing Duration
The next Interaction to Next Paint phase is processing duration. The advice about long tasks above also applies here. Aside from that, you can do the following to improve it.
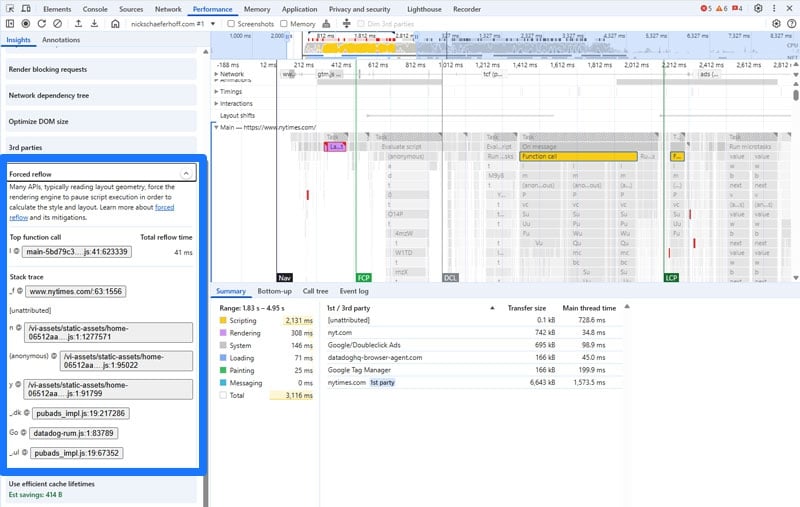
Avoid Layout Thrashing and Forced Reflows
Layout thrashing happens when scripts write and read element styles (like sizes or positions) too often and too quickly in succession. Forced reflows occur when the browser has to stop and recalculate the layout because of those changes.
For example, this might happen when a piece of JavaScript checks the size of a website element a user interacts with to change its size, and then immediately checks the size again. This makes the browser stop and recalculate the layout each time — which slows things down and can make the page feel unresponsive.
Instances like this appear in Chrome developer tools Performance traces, so you can spot them.
To avoid it:
- Generally, try to avoid manipulations that change the page layout, meaning changes to the width, height, or position of elements. Use properties like transform and opacity instead.
- Avoid reading layout values (like offsetHeight) right after changing styles.
- Don’t mix reads and writes in the same loop or function, group them consecutively.
- Avoid using layout-triggering properties inside frequently running code.
| 💡 You can find more details on this topic on web.dev. |
Optimizing Presentation Delay
You can improve the final phase, presentation delay, in the following manner.
Reduce DOM Size and Complexity
DOM stands for Document Object Model. It’s the structure of a webpage as seen by browsers.
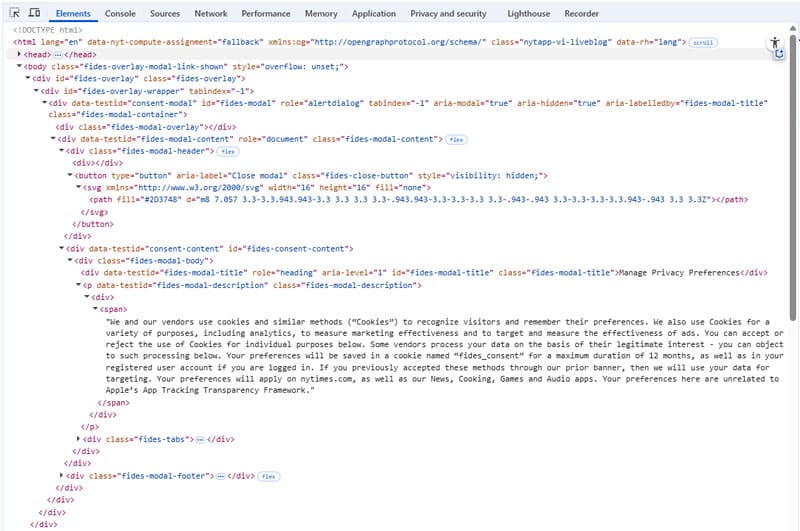
Its size is important because the browser often needs to recalculate and repaint parts of the page when the DOM is manipulated by JavaScript. A large or deeply nested DOM tree slows down how quickly the browser can do that, which directly affects Interaction to Next Paint.
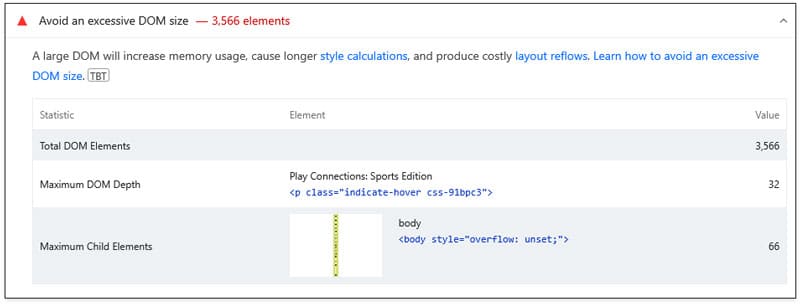
You can view your DOM size in the Chrome developer tools Elements panel and you may get warnings to “Optimize DOM size” or “Avoid an excessive DOM size” in PageSpeed Insights.
How do you reduce the DOM complexity?
- Reduce the number of elements: The less HTML there is, the less the browser must parse and update.
- Reduce the DOM depth: Avoid unnecessary wrappers or deeply nested elements, meaning elements stacked inside each other.
- Use semantic HTML and lightweight CSS: Take advantage of established structures and use simple selectors to help the browser match styles faster.
- Minimize dynamic UI elements: Reduce the need for recalculating layout and redrawing pixels on screen.
Avoid Excessive DOM Manipulation
Even if you have fewer elements, changing too many of them with JavaScript at once can still negatively impact page responsiveness. This can happen, for example, through:
- Changing styles on many elements repeatedly.
- Updating layout during scroll or click events.
- Manipulating DOM elements every few milliseconds.
Therefore, besides simplifying your site structure, avoid manipulating it too much by:
- Only making DOM changes when truly needed.
- Grouping changes together instead of doing them one at a time.
- Not updating elements over and over in a loop — do it once when possible.
Address “Recalculate Style” Events
“Recalculate Style” events happen when the browser has to figure out which styles apply to which elements. This can be a slow process on complex pages and is often triggered by DOM changes, JavaScript that manipulates classes, or dynamic styling.
You can visualize these events in the Chrome developer tools. In the Performance tab settings (the cogwheel icon), switch on Enable CSS Selector stats (slow). When you now record a performance trace again, it will show Recalculate Style events in your recording.
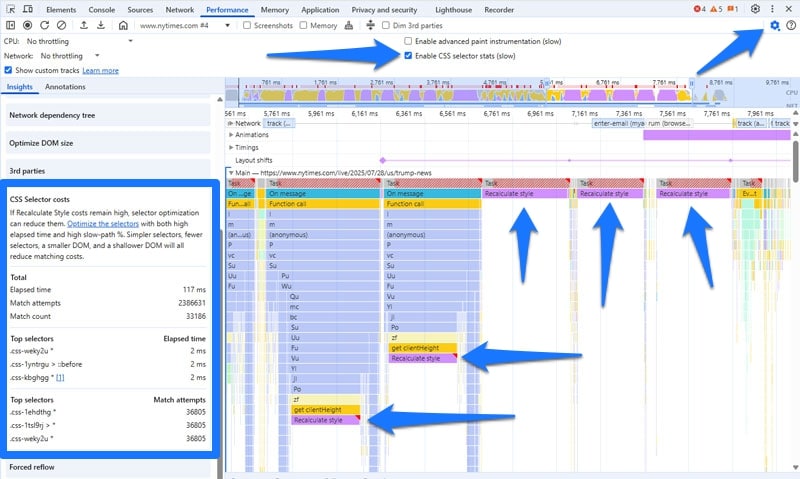
To address them:
- Use simpler, more targeted CSS selectors (for example, .red-box instead of .box:nth-last-child(-n+1)) to reduce browser computation needs.
- Avoid adding or changing classes rapidly during interactions, to prevent constant style recalculations.
- Don’t make big style changes to many elements at once to avert overloading the browser.
| 💡 Note that this is only necessary if the Recalculate Style event is part of a long task. Enable CSS Selector stats (slow) is a debugging tool and might result in more long tasks showing on your tests. Those are not worth investigating or trying to get rid of, which is why you should turn off CSS selector stats if you’re not actively debugging Recalculate Style. |
Use Lazy Rendering
Lazy rendering means waiting to show or build parts of the page until the user actually needs them. There’s a similar term, lazy loading, that applies this concept to images.
Lazy loading initially only loads images that are visible immediately when you access a web page but fetches the rest individually as visitors scroll down.
Lazy rendering works the same way but for all other content. It reduces the amount of work the browser has to do up front, allowing the page to load quickly and keeping it responsive to user input.
You can achieve this with the CSS content-visibility property and by only creating or inserting elements into the DOM via JavaScript when they’re about to be visible.
Optimize the Viewport for Mobile
On older mobile browsers, there used to be a 300 millisecond delay after you tapped something before it responded. That’s because the browser waited to see if you were doing a double-tap to zoom.
Naturally, that built-in delay hurts your INP measurement (try to stay below 200ms, remember?). Modern browsers remove that delay automatically — but only if your page is set up with the correct viewport meta tag:
<meta name="viewport" content="width=device-width"> How to Improve the Interaction to Next Paint Insight Via Plugin
If much of the above seems a bit too technical for your skill level, you can also improve your site’s INP insight using a performance plugin like WP Rocket. It comes with the following features that directly help with this performance audit:
- Ability to minify, combine, defer, and asynchronously load JavaScript
- Delay JavaScript execution until the user interacts with the page
- Removing unused CSS to reduce browser work when styling the page
- Lazy loading for images, including CSS backgrounds, videos, and iframes
These features help reduce long tasks and script-heavy delays that hurt INP. They either happen automatically or by simply checking a few boxes.
Aside from that, WP Rocket automatically implements further performance improvements in the background, such as:
- Caching, including a separate mobile cache
- Preloading cache and links
- Critical image optimization to improve Largest Contentful Paint
Consequently, when you install and activate the plugin, it implements 80% of performance best practices on your site, speeding it up without any work on your end. If that isn’t enough, you have many other features you can activate to increase your site speed, like:
- Preloading external files and fonts
- Database optimization
Curious about what kind of impact these measures can make on your site performance? We’ll examine that next.
Case Study: Making Your Site Faster With WP Rocket
For this test, we set up a demo WordPress site using a default theme and several popular plugins, including dynamic content like sliders, an embedded video, a web form, and a cookie consent banner. The goal was to recreate the typically unpleasant user experience on an unoptimized website with lots of JavaScript-powered features.

Then we ran a baseline performance test using PageSpeed Insights. Here are the results:
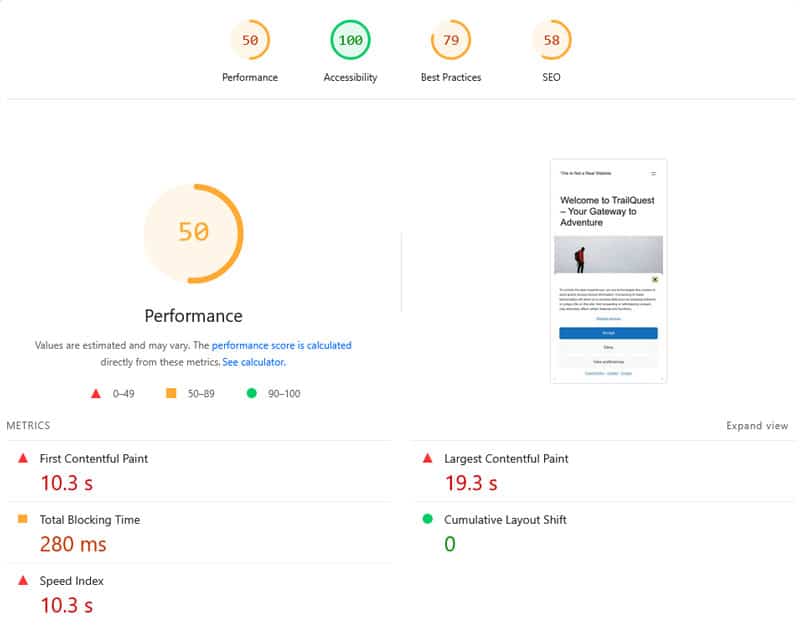
| Mobile Performance score | 50 |
| First Contentful Paint | 10.3s |
| Largest Contentful Paint | 19.3s |
| Speed Index | 10.3s |
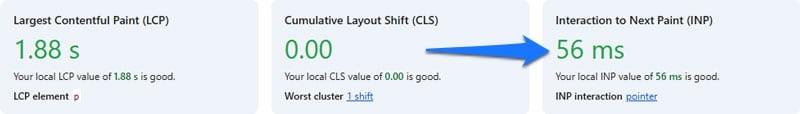
We also used Chrome’s developer tools to track real-time performance data and tested every interactive element. It resulted in an INP value of 56ms.
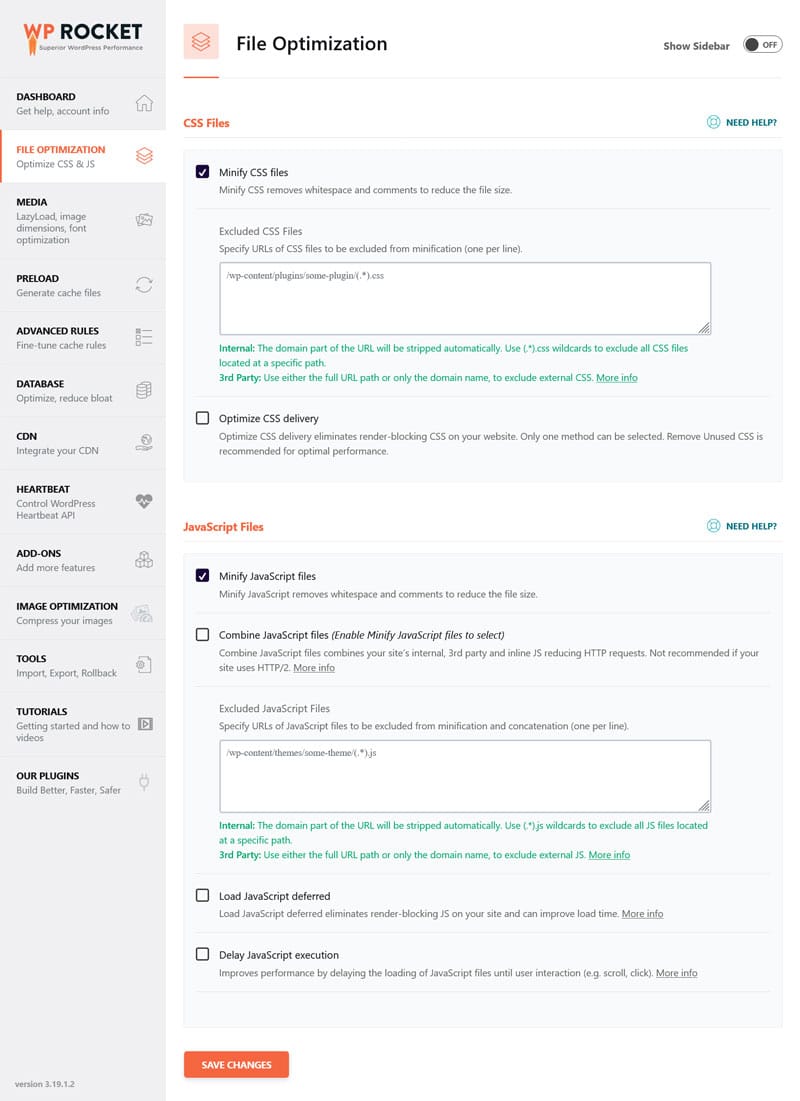
While the INP value is pretty good, the overall performance isn’t and wouldn’t provide a good user experience. To combat that, we enabled WP Rocket and turned on the following features:
- Minify CSS and JavaScript files (enabled by default)
- Load JavaScript deferred
- Delay JavaScript execution
- Enable LazyLoad for images and videos
After making these changes, we re-ran both tests on the same page.
First of all, the INP value stayed the same. This is to be expected. The initial result was already good so there wasn’t too much room for improvement.
On the other hand, PageSpeed Insights showed noticeably improvements.
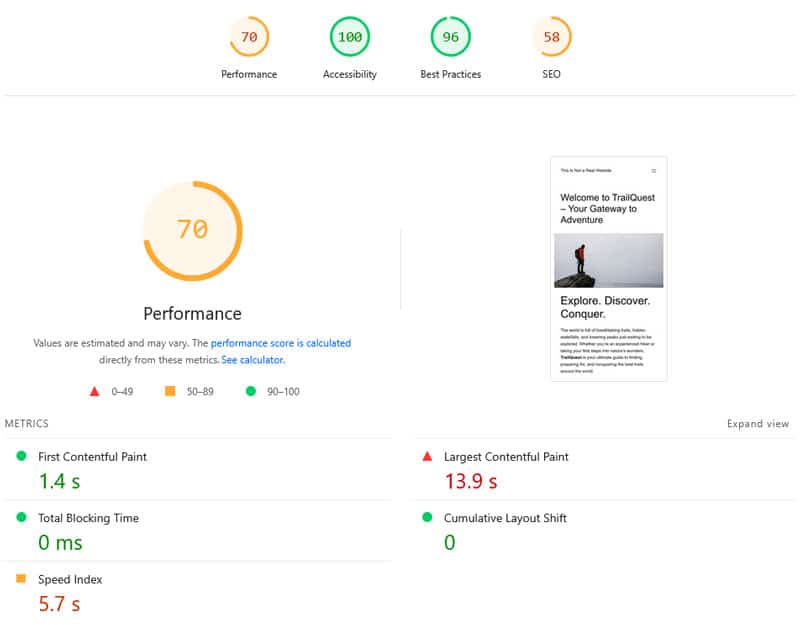
| Mobile Performance score | 70 |
| First Contentful Paint | 1.4s |
| Largest Contentful Paint | 13.9s |
| Speed Index | 5.7s |
What stands out is the massive improvement of First Contentful Paint. A reduction of almost nine seconds—that’s practically an eternity in web page loading speed.
But why is the Largest Contentful Paint value still so high?
It comes down to the LCP element, which is the slider at the top of the page. It’s very heavy and, since it’s above the fold, doesn’t benefit from lazy loading.
To further improve the page’s performance, you would have to take targeted action on this singular element. For example, here are the speed testing results after optimizing the images in the slider using Imagify.
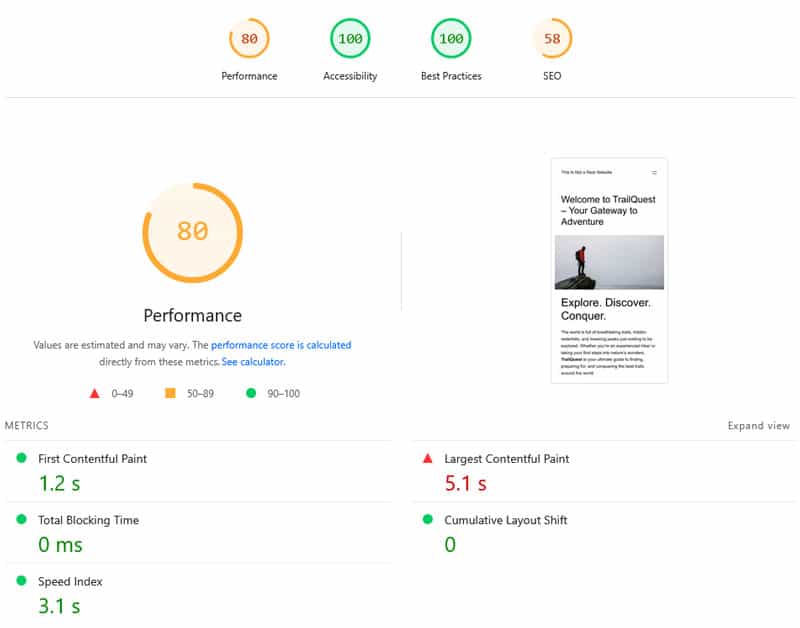
While there is still room for improvement, it’s a lot better than the initial situation of a PSI score of 50 and almost 20 seconds of loading time for the main content. And all it took was a few mouse clicks.
Make Your WordPress Website Responsive
Interaction to Next Paint (INP) is a key Core Web Vitals metric and an indication for how well your site responds to user input. The new INP insight in Lighthouse gives you deeper visibility into what’s slowing down your site and how to fix it.
Improving INP manually involves optimizing JavaScript, reducing heavy scripts, simplifying your layout, and making your page react faster. If you are looking for an easier path, give your site an instant boost with WP Rocket. Try it for 14 days, completely risk-free.