
Table of Contents
Last update on
Pingdom, GTmetrix, and WebPagetest are the three most popular options available for testing website speed and performance. But when you scan your website with each of these tools, they invariably offer very different results.
For instance, check out the results I get when I run the same site through each of these tools using their default settings:
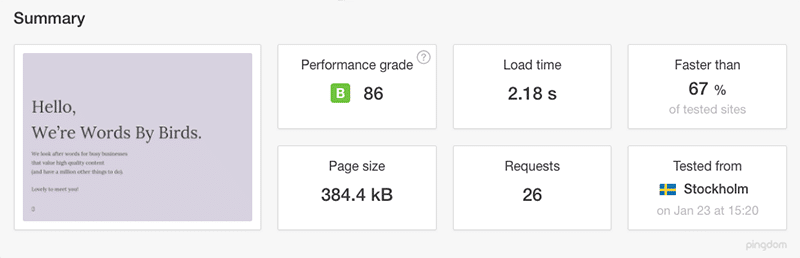
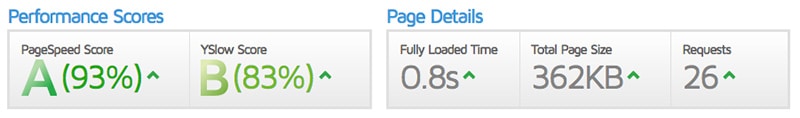
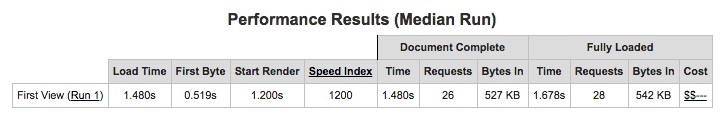
It’s easy to get overwhelmed by all the data these tools spit out when you measure the speed of your site. But putting aside all the different information for a moment, let’s focus on load time: how about those wildly different times, right?!
GTmetrix tells me my site is lightning fast, loading in less than a second. Meanwhile, Pingdom says my site takes 2.18 seconds to load and WebPagetest says it’s almost half that at 1.48 seconds.
At first glance, these tools look like they offer similar features. But there are some important key differences that explain why my site’s load time varies so much from tool to tool.
In this post, we’ll take a look at what these key differences are so the next time you test your website you’ll have a better understanding of your performance results.
1. Test Location
The test location you choose plays a big part in determining your site’s results. The geographical distance between the test location and the server where your website is hosted means latency and the quality of the network connection both becomes factors at play.
My site is hosted in San Francisco. Since I used the default test location for each tool when I scanned my site, Pingdom tested from Stockholm, Sweden; GTmetrix tested from Vancouver, Canada; and WebPagetest tested from Dulles, Virginia.
Dulles, and even more so Stockholm, are much further away from San Francisco than Vancouver is, which explains the big difference in my load time results – testing my site from Vancouver produced a much faster page load time than testing from Stockholm.
It’s always best to choose the location that’s closest to your target audience for the most accurate picture of your page load. Pingdom, GTmetrix and WebPagetest each offer multiple locations to test from:
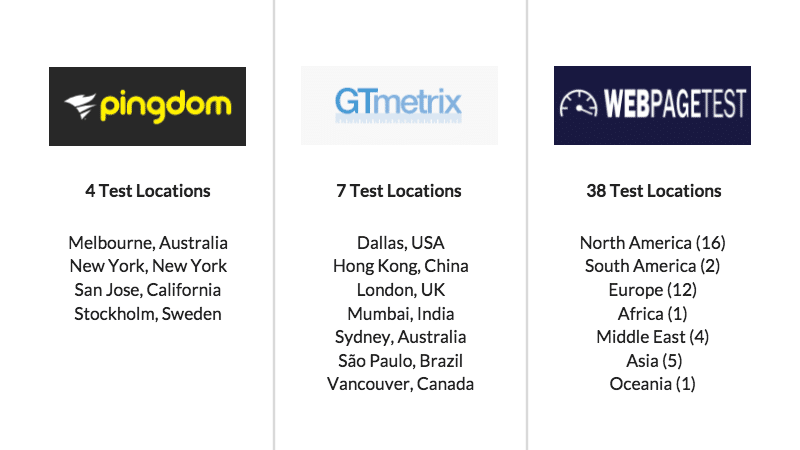
While GTmetrix has seven test locations, it provides a total of 28 dedicated test servers: 11 in Vancouver, five in Dallas, seven in London, two in São Paulo and one each in Sydney, Mumbai and Hong Kong.
Pingdom’s tests are also done from dedicated servers.
WebPagetest, however, is able to provide so many test locations because anyone can host a test location for them. There are minimum system requirements, of course, but when testing your site with WebPagetest it’s best to assume that not all servers have the same hardware, and therefore not the same performance.
2. Time to Stop Testing
When each of these three tools finishes testing your site impacts your results. If you’re new to site performance testing, you might be surprised to know that there isn’t simply one time when these tools decide their analysis is complete.
There are two different points during the loading of a web page that can are generally used determine when a performance test should be stopped:
Onload time is when the web page has finished processing and all of the resources on the page, including images, text and scripts, have finished downloading. During this time, there may be JavaScript that initiates subsequent requests. Some elements of the page may not make it in before this event fires, causing inconsistent page load times.
Fully loaded time is measured as the time from when the visitor initially navigated to the page until 2 seconds after there’s no network activity. This event fires when a page has completely stopped loading content, including below the fold elements. This means that while your site may have loaded fast above the fold, the performance scan waits for the entire page to stop loading data before it stops, so the page load time might be longer.
Each of the three testing tools offers different options for when you want to complete a performance analysis:
- Pingdom: Onload time is the only option available.
- GTmetrix: Fully loaded time by default, with onload time optional.
- WebPagetest: Fully loaded time by default, with onload time (aka Document Complete time) optional.
Testing your site using onload time as the time to stop means that some resources, such as JavaScript sliders, might not finish downloading before onload time is triggered. This means that while the testing tool you’re using tells you the page has finished loading, it actually hasn’t – and for visitors viewing your site there, this means elements would still be loading on the web page.
3. Performance Scores
It’s not unusual for performance scores to vary wildly between tools since each follows its own set of configurations and speed recommendations.

WebPagetest tests pages against a custom set of six speed recommendations.
- Pingdom offers a performance grade in line with Google’s PageSpeed performance best practices for its free tool and YSlow recommendations for the paid version. It’s not clear which, or how many, recommendations contribute to the grade.
- GTmetrix uses a combination of Google’s 27 PageSpeed recommendations and 19 YSlow recommendations (YSlow is a tool that analyzes web pages based on Yahoo!’s rules for high performance sites)
- WebPagetest analyzes web pages against six custom recommendations.
As you can see, each of these tools analyzes web pages using different, customized sets of recommendations. This is why scores differ so much and you shouldn’t compare your results between each tool.
4. Extra Features
There are some other features that further set each tool apart from the others.
Note: In order to access some of these free features with GTmetrix, you will need to sign up for a free account.
Connection throttling
How quickly visitors can connect to your site also determines how fast it loads. GTmetrix and WebPagetest both offer a connection throttling feature to simulate the different types of internet connections your site visitors might be using:
- GTmetrix: Cable, DSL, 3G mobile, 2G mobile, and 56K dial-up
- WebPagetest: Cable, DSL, 3G Slow, 3G, 3G Fast, 4G, LTE, Mobile Edge, 2G, 56K dial-up, FIOS, Native Connection, and custom speed.
Pingdom doesn’t offer connection throttling.
Mobile Testing
GTmetrix and WebPagetest each offer mobile performance testing so you can see how your site stacks up for visitors accessing your site on their mobile phones.
GTmetrix uses two Samsung Galaxy Nexus phones, allowing users to generate performance reports based on actual page loads on these devices. GTmetrix uses Google’s PageSpeed rules with their prioritization for mobile devices to ensure the characteristics of mobiles and their connections are prioritized in the recommendations. Since YSlow doesn’t have a specific ruleset for mobile devices, scores remain similar to the desktop analysis.
In order to use GTmetrix’s mobile testing feature, ensure you’re logged in to your GTmetrix account and click the “Browser” link under the analysis field. Keep clicking until you get the “Chrome (Android, Galaxy Nexus)” option. When you enter your website and click “Analyze” a mobile report will be generated. Currently, this feature is only available in GTmetrix’s, Vancouver test region.
WebPagetest has 14 mobile devices as part of its mobile testing suite. In order to use its mobile testing feature, select the device you want to use from the “Test Location” dropdown before starting your test. All of the mobile testing devices are based in Dulles, Virginia.
Alternatively, you can run a test that emulates a mobile browser. To do this, click “Advanced Settings” and then the “Chrome” tab. Check “Emulate Mobile Browser” and in the dropdown select the model of the phone you want to test.
Hardware
The hardware that Pingdom, GTmetrix, and WebPagetest each use are also a determining factor when it comes to carrying out analyzing site performance.
As I mentioned earlier, WebPagetest lets anybody host a test server as long as they meet minimum requirements. GTmetrix uses a variety of different server platforms, which are fine-tuned so that browsers load pages more consistently across all testing servers, no matter where they are in the world.
Support for HTTP/2
HTTP/2 attempts to solve many of the shortcomings and inflexibilities of HTTP/1.1. Its benefits include multiplexing and concurrency (several requests can be sent in rapid succession on the same TCP connection, and responses can be received out of order), stream dependencies, header compression, and server push.
When implemented and used correctly, HTTP/2 loads web pages faster than HTTP/1.1. But in order to use enjoy this performance improvement, both the client and the server need to support HTTP/2. According to W3Techs, HTTP/2 is currently used by 42.6% of all websites.
Real browsers
While some page speed testing tools use headless, or emulated, browsers, Pingdom, GTmetrix and WebPagetest all use real browsers, with Chrome by default. Real browsers provide a better indication of your site’s performance, and the results are typical of what an actual visitor would see while viewing your site using the same browser and device.
Conclusion
I hope this guide has helped clarify for you what the main differences are between Pingdom, GTmetrix, and WebPagetest. Each of these tools offers a different feature set for page speed testing using their own testing methodologies, which is why you see different results. Despite their differences, each of these tools provides immense value in helping to identify areas where your site might be slow and providing recommendations for how you can speed it up.
Deciding which tool you use really comes down to the metrics you want to track and measure for your site. Here are my recommendations for different scenarios:
- General testing: Pingdom, GTmetrix and WebPagetest
- Historical testing: GTmetrix and WebPagetest
- Comprehensive testing: GTmetrix and WebPageTest
- Location testing: Pingdom, GTmetrix and WebPageTest
- Advanced use: GTmetrix and WebPagetest
If you’re wondering why PageSpeed Insights isn’t featured in this post, it’s because I intentionally left it out. While PageSpeed Insights is a useful tool for checking your site against Google’s speed rules, it doesn’t offer speed testing in the way that the other tools do – it would be like comparing apples with oranges.