
How to Reduce Total Blocking Time (TBT) on Your WordPress Site
Table of Contents
Wondering what’s the Total Blocking Time metric and how it affects the performance of your WordPress site? You are at the right place.
We all love websites that are pleasant, easy to use, and fast. To make sure you provide a great user experience, there are a few metrics you should focus on, and TBT is one of them.
More importantly, as a user experience metric, Total Blocking Time holds up 30% of the global performance score computed by Lighthouse. This makes it a top metric for optimization!
We are going to explain in detail what Total Blocking Time is, why it’s relevant, how to measure it, and what factors affect its score. We’ll also share some tips on fixing a bad Total Blocking Time grade (TBT longer than 300 ms) to improve your overall performance score and make your visitors happy.
What is Total Blocking Time (TBT) in Lighthouse?
Total Blocking Time is an important performance metric that measures the load responsiveness of your WordPress site. It is the sum of all time periods between First Contentful Paint (FCP) and Time to Interactive (TTI) when a task length exceeds 50ms. The score is always expressed in milliseconds. It counts for 30% of your total performance grade performed by Lighthouse.
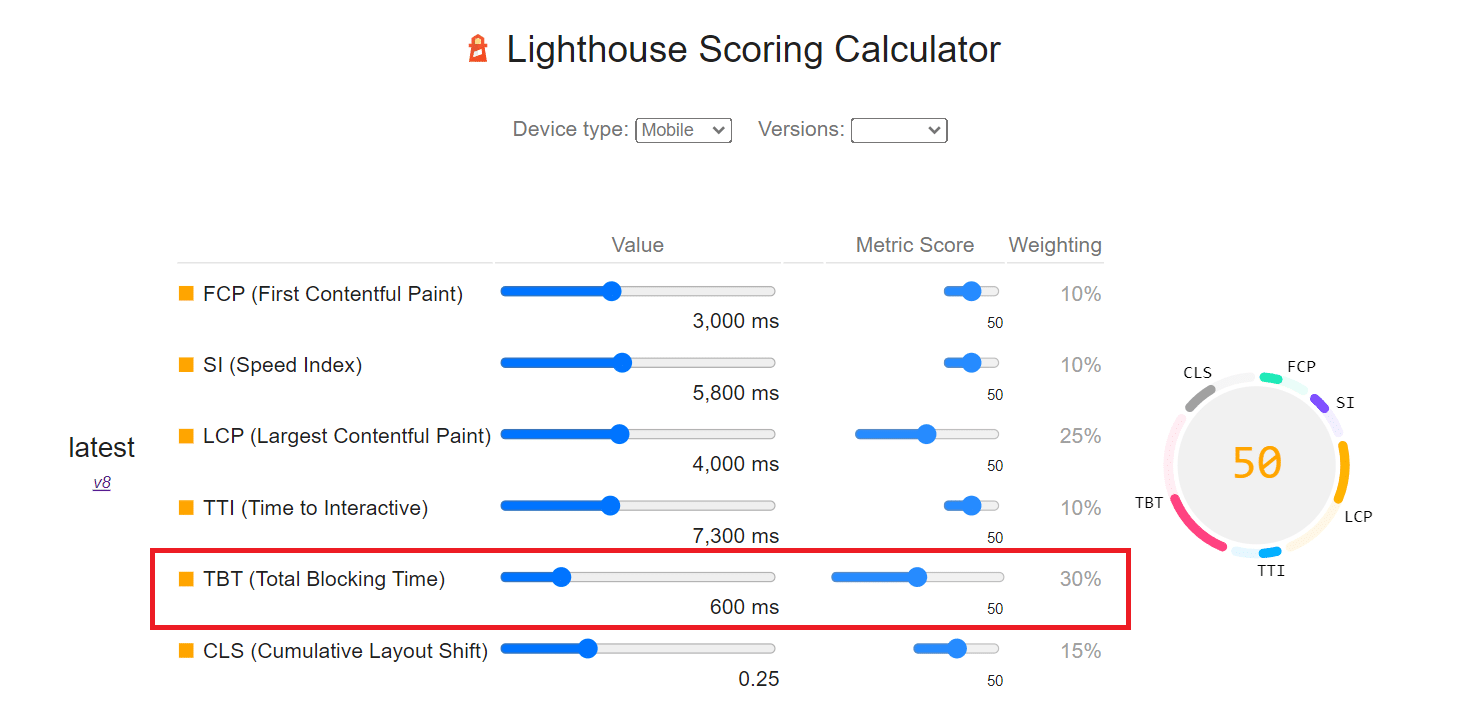
Lighthouse is an open-source, automated tool that assists developers in improving the quality of web pages. The tool considers six metrics to generate your final performance score, including the Core Web Vitals, the Speed Index, the Total Time to Interactive, and the Total Blocking Time:
| Metric | Weight | What’s a good score? (green) |
| First Contentful Paint | 10% | 0-2 s |
| Speed Index | 10% | 0-4,3 s |
| Largest Contentful Paint | 25% | 0-2,5 s |
| Time to Interactive | 10% | 0-5s |
| Total Blocking Time | 30% | < 300 ms |
| Cumulative Layout Shift | 15% | 0 – 0,1 |
💡 If you need help to perform your website’s audit, we recommend reading our complete guide that explains how to improve your Lighthouse performance score.
How to Measure Total Blocking Time
You can measure the TBT score by calculating the total amount of time that a page is blocked from responding to a user action. The total is calculated by adding the blocking time of all long tasks between First Contentful Paint (FCP) and Time to Interactive (TTI).
Let me explain better.
Every browser has a process that transforms the code into a web page. This action of processing all the code and styles needs to be effective because we want our page to be rendered as quickly as possible for the visitor. (Remember, we want to make a good impression and show the user how fast our website is!)
The browser has many tasks to complete until it can render the page, such as parsing the HTML script, building the structure and the content of a web page (DOM), and executing its CSS and JS code. (That’s a lot to do, right?)
To avoid a high blocking time, the browser should not encounter the JS and CSS files when parsing the code and rendering the page. To keep your website going fast, we have to “tell” the browser what we want to prioritize and what we want to load first.
Understanding Long Tasks
If the tasks run longer than 50ms, it is referred to as a Long task and considered “blocked.”
In such a case, your page becomes unresponsive to user inputs like screen taps, keyboard presses, mouse clicks, etc.
The calculation of Total Blocking Time is based on those Long Tasks. A Long Task significantly monopolizes the web browser (> 50 milliseconds) and blocks the performance of other essential tasks (such as reacting to user actions with a mouse click). The main thread is considered “blocked” any time there’s a Long Task. The computer records this interval for each request as an individual blocking time. The sum of all individual blocking times is called total blocking time.
Let’s see an example. Every time Lighthouse detects a Long Task (>50 ms) then it will also measure the blocking duration:
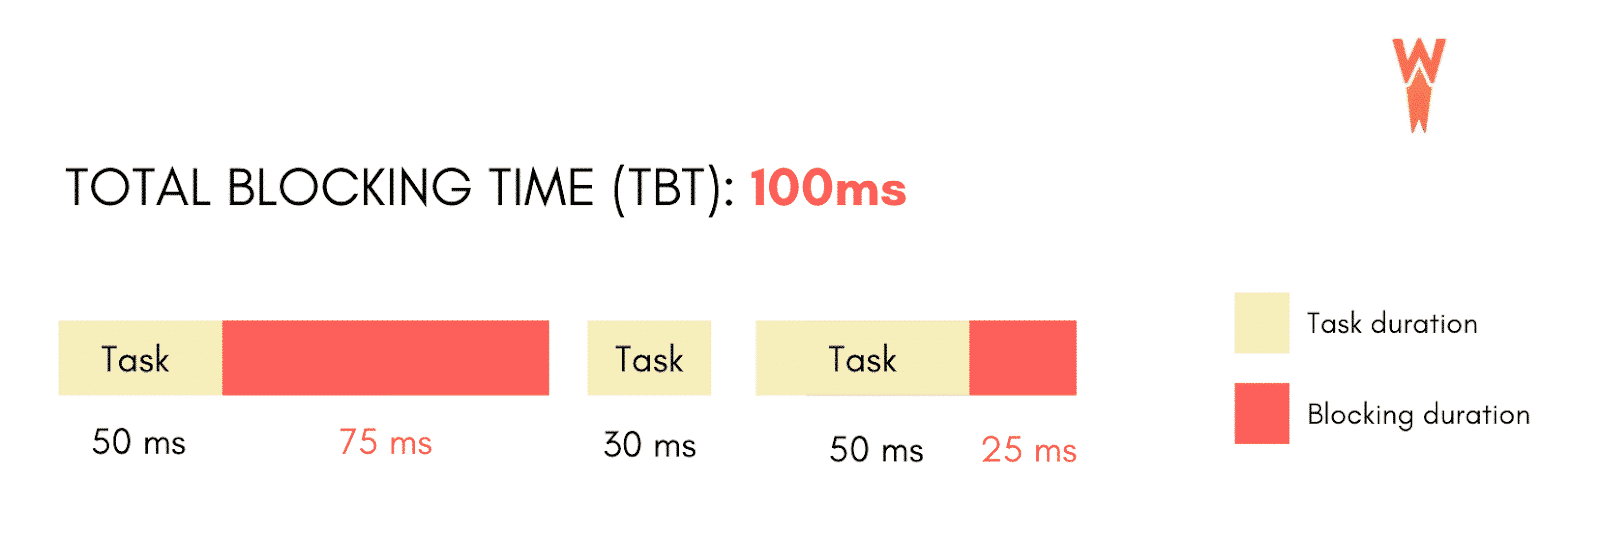
As you can see, the Total Blocking Time is a sum calculated by adding the “blocking” portion of the different Long Tasks. The blocking portion of a Long Task is the part of its duration beyond 50 ms (in red on our chart).
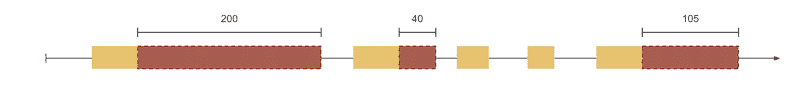
Let’s see another task’s breakdown to identify the TBT:
- The timeline below has five tasks, and three are Long Tasks (duration >50 ms):
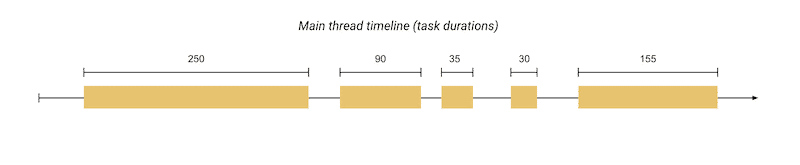
- The next graph shows the blocking time for each of the long tasks, respectively 200 ms, 40 ms, and 105 ms (Total: 345 ms):
| TBT: The sum of the blocking time for each long task (>50ms) that occurs between FCP and TTI. FCP: First content to be loaded by the browser. It’s all about speed perception from the user. TTI: How long it takes to be sure, regarding the conditions, that interactivity can happen in a satisfactory way, for at least 5 seconds. |
2 Tools to Measure Total Blocking Time
We recommend two different tools to measure TBT and your performance using the Lighthouse technology.
- Google PageSpeed Insight (PSI):
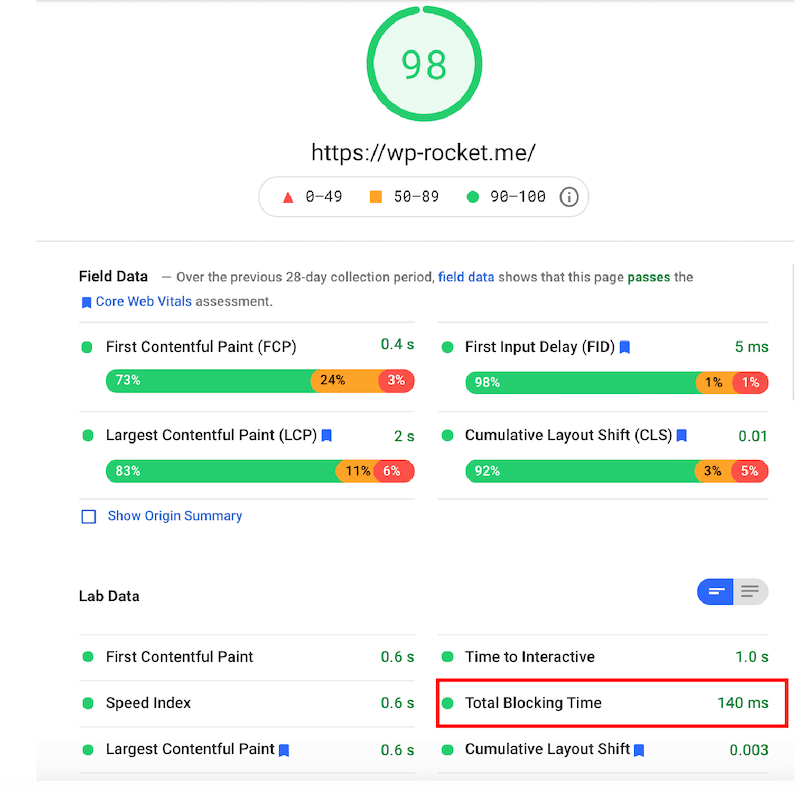
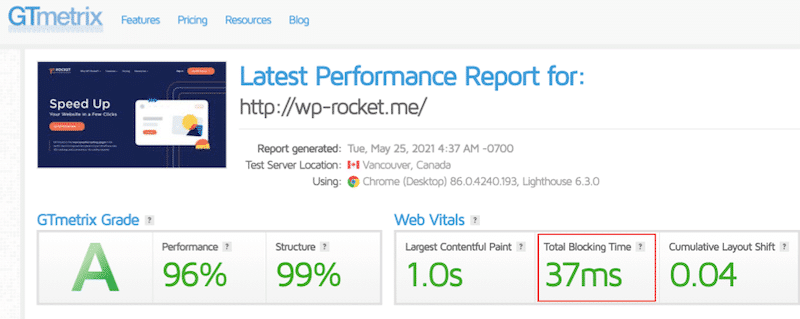
Both tools provide a TBT score, but the numbers are slightly different, as you may have noticed. This is mainly due to various factors, including Lighthouse implementation, testing methodology, testing location, etc.
| 🚀 If you need some help performing the audit, we recommend you to check our complete guide about testing WordPress site performance and measuring the results. |
What’s a Good Total Blocking Time (TBT) Score?
You should always strive to have a TBT of less than 300 ms to ensure a good user experience. Your TBT score is simply a comparison of the TBT time of your page and the TBT times of high-ranking thousands of sites when loaded on mobile or desktop.
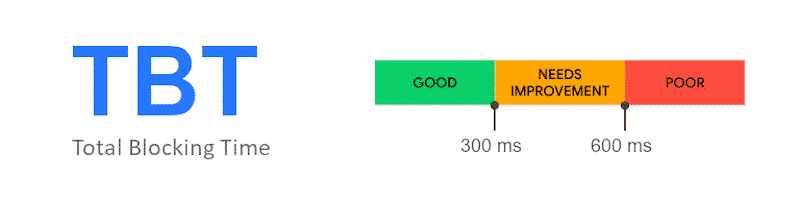
Scoring is classified as:
- Green: 0-300ms (Fast)
- Orange: 300-600ms (Moderate)
- Red: 600+ms (Slow)
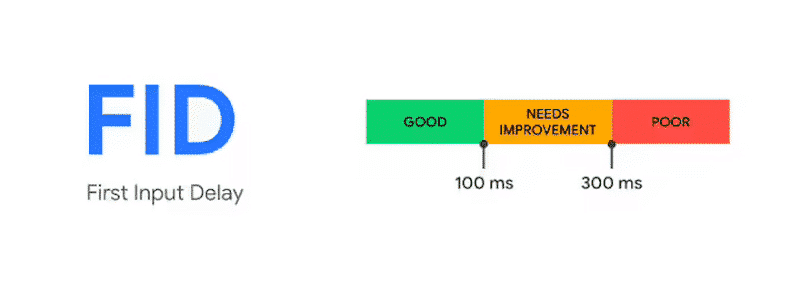
Total Blocking Time is often associated with the FID (First Input Delay) metric. Let’s see why.
What Is the Difference Between Total Blocking Time and First Input Delay?
The difference between Total Blocking Time and First Input Delay is simple: while Total Blocking Time can be calculated without real-world users, First Input Delay is a field-only metric that requires real-user data for computations.
The FID calculation cannot be simulated in a lab environment. This form of data comes from multiple sources, such as the Chrome User Experience Reports (CrUX), where the data collected are from real-world users.
When your website does not have enough “real” data to compute the FID score, the alternative is to look at the TBT metric, measured in the lab data section. The lab data has artificial and collected data from a single device based on a fixed set of network conditions.
In a different way, both TBT and FID measure interactivity and capture a user’s first impression of a site’s interactivity and responsiveness.
For example, GTmetrix tests TBT instead of FID as it diagnoses almost the same optimizations with the suitable proxies:
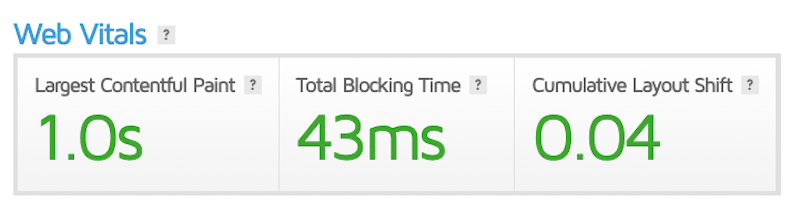
By optimizing your Total Blocking Time, you’ll also improve the First Input Delay score, one of the Core Web Vitals metrics — there is a positive correlation between them. Of course, the opposite is also true.
If you keep your FID below 100ms, you’re in great shape:
What Is the Difference Between Total Blocking Time and Time to Interactive?
The main difference is that Time to Interactive measures how long it takes for a page to become fully interactive, while Total Blocking Time tells you which JS tasks took the longest to execute.
Time to Interactive is another metric that is related to your page interactivity. It’s one of the six metrics tracked in the Lighthouse report to measure the performance of your website.
Measuring TTI is vital because some sites focus on content visibility at the expense of actual interactivity. This can create a frustrating user experience: the user thinks that the site is ready, but when he tries to click somewhere, nothing happens.
TTI (in orange below) marks a page as fully interactive if the main thread has been free of long tasks for about 5 seconds.
Here’s a test for you. In the following image, when do you feel like you could interact? When does the blue-button become “clickable” in your mind?
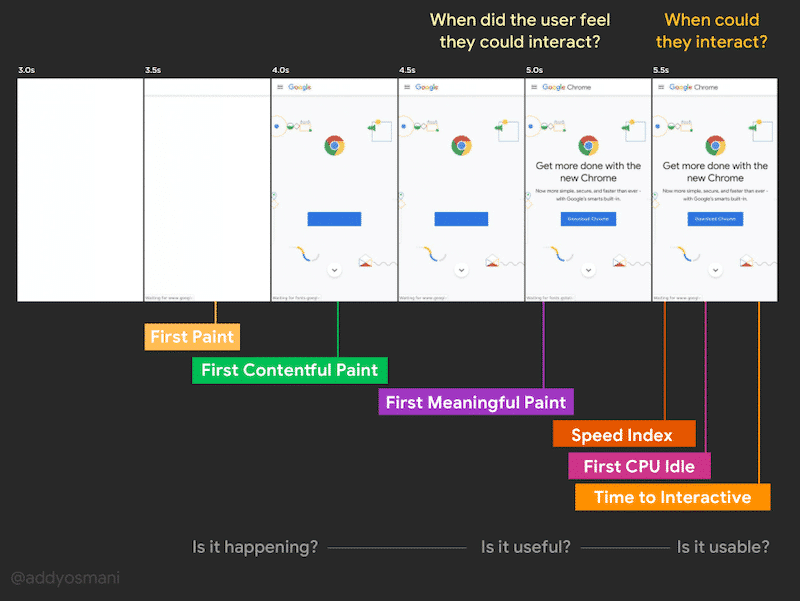
You should strive to have a Time to Interactive of less than 5 seconds to ensure a good user experience.
What Is the Impact of Total Blocking Time on Performance?
To understand the impact of TBT on performance, once again we should highlight its weight on the Lighthouse Score.
As a user experience metric, TBT now holds up to 30% of the global performance score.TBT did not exist in Lighthouse v5, but it now represents 30% of the total grade in Lighthouse v8.
TBT measures the total amount of time your webpage was completely blocked, preventing the user from interacting with the sections of your page. It’s an important lab metric because it defines if your page is usable or not.
There are several basic principles to follow to keep your TBT under 300ms but first, let’s have a look at the causes of a bad TBT.
What Causes a High Total Blocking Time?
There are four reasons that determine a TBT score longer than 300 ms, namely:
- A messy JavaScript code and unused JS
- A high JS Execution time
- A high main thread work
- Heavy use of a third-party code
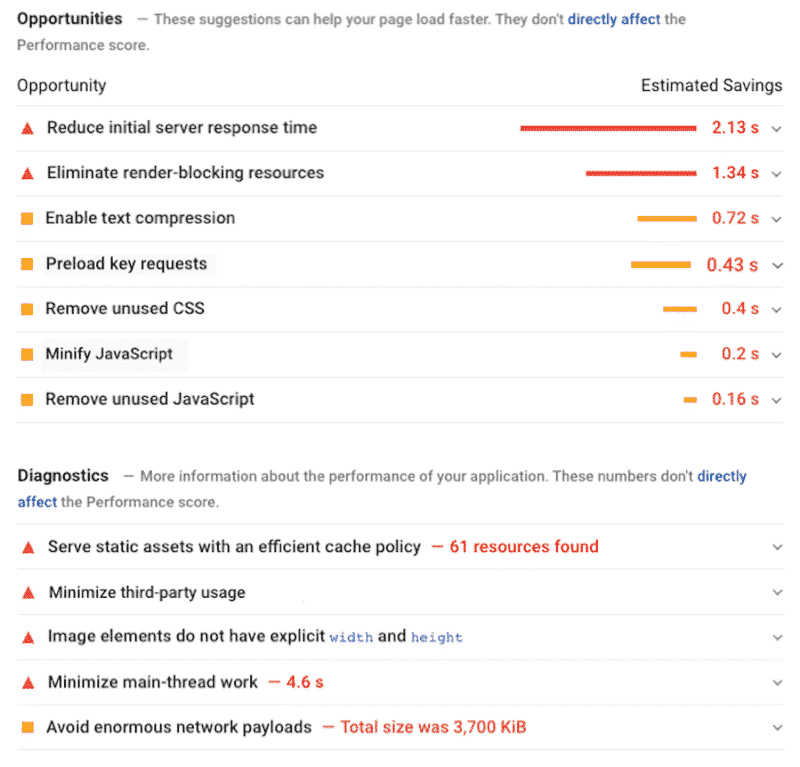
Going to the opportunities and diagnostics section of your Lighthouse report will help in determining what solutions you can implement:
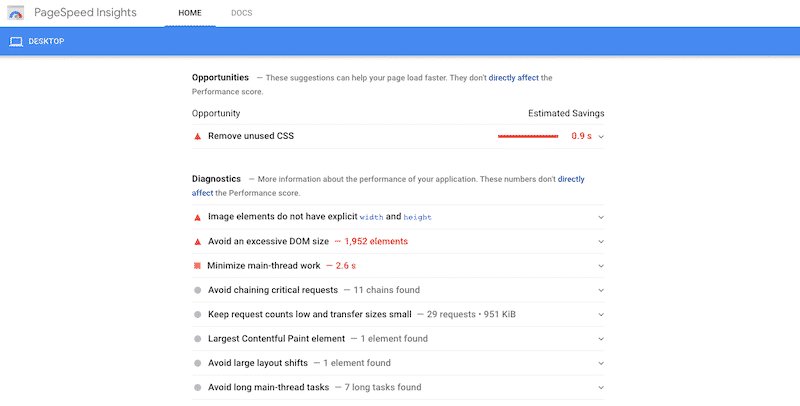
The report shows how much impact each error has on your estimated savings; resolving them will drastically improve your TBT and your site’s performance.
Here is the list of the PageSpeed Insights recommendations to address if you want to improve your TBT score:
- Remove (or reduce) unused Javascript
- Reduce Javascript execution time
- Minify CSS and JS
- Eliminate render-blocking resources
- Reduce the impact of third-party code
- Enable text compression
- Avoid chaining critical requests
- Avoid enormous network payloads
- Minimize main thread work
(Spoiler alert: the majority of the TBT optimizations can be done using the WP Rocket plugin!)
How to Reduce Total Blocking Time Longer Than 300 ms on Your WordPress Site
To fix your TBT score longer than 300 ms, you should focus on the order and loading preferences of your resources, as well as the number and size of requests. The most effective way to reduce Total Blocking Time in WordPress is to optimize JavaScript files (including third-party code).
| Important: Any good measures going towards JS execution will most likely reduce TBT. |
There are eight performance optimizations we recommend you implement if you want to fix Total Blocking Time and improve the speed of your WordPress site.
- Defer JS
- Delay JS
- Prefetch DNS Requests
- Minify JS
- Use GZip Compression
- Minify CSS Files
- Optimize CSS Delivery
- Reduce Server Response Time and Time to First Byte (TTFB)
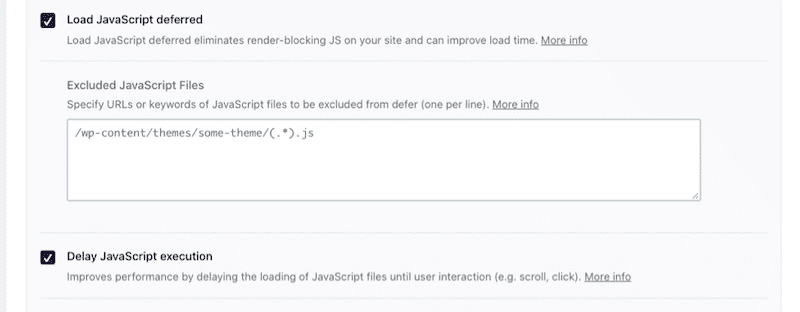
1. Defer JS
Defer JS means to delay JS loading until a certain time. In this case, the JS files will be loaded after the browser has displayed the most relevant content. By deferring JavaScript files, you’ll make your JavaScript load faster – which is invaluable for improving your WordPress site’s performance. Reducing the amount of time spent in parsing, compiling, and running JS files also helps with improving TBT.
Lighthouse issue from the diagnostic section: It addresses the “Eliminate render-blocking resources”, “Remove unused JavaScript” and “Avoid chaining critical requests” recommendations.
✅ Manual Solution:
- Use the Defer Attribute: When trying to defer JS you can use boolean attributes “defer” for the script tag in HTML:
<script src=”code.js” defer></script>
JS files will be executed only after the rest of the page has loaded.

✅ Use a WordPress plugin:
- Asset CleanUp: this free plugin scans and detects the content to be loaded on the page. When editing a page, all you have to do is to select the CSS or JS code that is not useful.
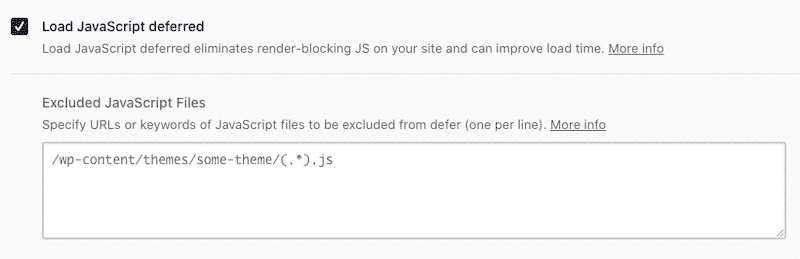
Important Note: the plugin author recommends using Asset CleanUp with a cache plugin like WP Rocket to get the best results. - WP Rocket has an option to defer parsing of JavaScript and defer the JS WordPress files:
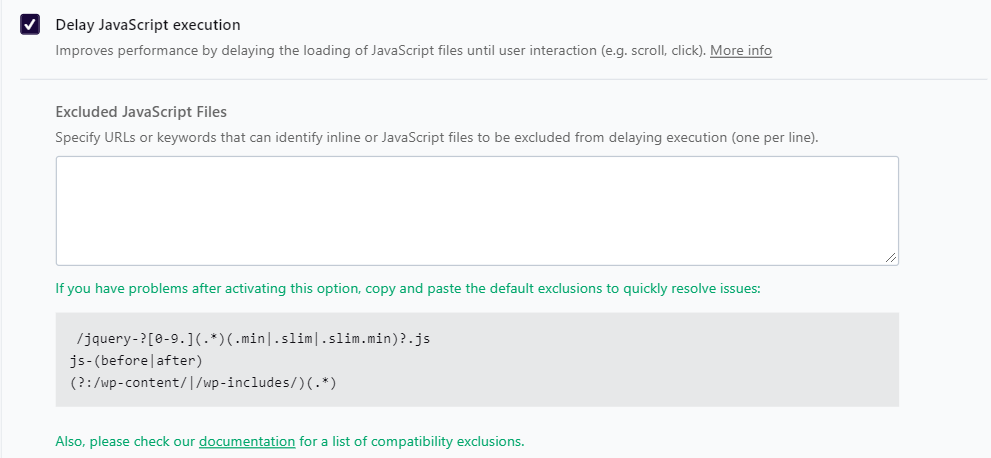
2. Delay JS
Delayed JavaScript Execution improves performance and TBT by delaying the loading of all JS files until a user interaction happens, such as touching the screen, scrolling, or clicking on a button.
Lighthouse issue from the diagnostic section: It addresses the “Avoid chaining critical requests” recommendation.
✅ Manual Solution:
- The manual way of creating a delay in JS is to use the setTimeout ()method function. This will call a function after the time you’ll specify in ms. You can find very helpful code snippets to delay any JS functions, but here’s an example you can follow:
Let’s say you want to achieve the following scenario:
“User clicks on a button → Wait 2 seconds → the page will display a “Hello, How Are You?”:
<button onclick=”setTimeout(myFunction, 2000)”>Try it</button>

<script>

function myFunction() {

  alert(‘Hello, How Are You? ‘);

}

</script>
✅ Use a WordPress plugin:
- Flying Scripts: a plugin to delay JS and give more resources to critical JS files. It helps to prioritize.
- WP Meteor: a plugin to postpone JS scripts and greatly improved the perceived speed by visitors (very important for the user experience).
- Gonzales: allows to conditionally disable CSS, JS, and even plugins depending on the page you visit.
- Asset CleanUp (just mentioned in the section above).
- WP Rocket cache plugin: the convenient way. You can easily delay the JS files in one single click.
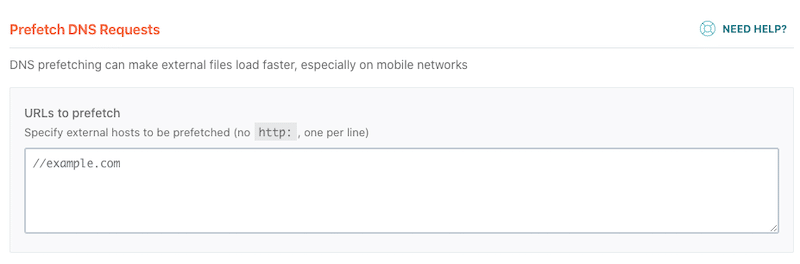
3. Prefetch DNS Requests
DNS-prefetch is an attempt to resolve domain names before resources get requested.
When is it useful? If you have a third-party code on your website such as a video hosted on Vimeo or some Google Fonts. DNS-prefetch can give your website a little boost as it will minimize the loading time and resources coming from another website. In other words, DNS-prefetch allows you to make early connections to third-party scripts, reducing the delay and bringing more efficient results.
Lighthouse issue from the diagnostic section: It addresses the “Minify third-party usage” and “Preconnect to required origins” recommendations.
✅ Manual Solution:
- Use “rel=dns-prefetch” in the “head” section. In other words, you can manually specify the domain for the browser to prefetch:
<link rel=”dns-prefetch” href=”//yourdomain.com”>✅ Use a WordPress plugin:
- Perfmatters plugin has the DNS prefetch options
- WP Rocket plugin also has a “Prefetch DNS Requests” section in its WordPress dashboard:
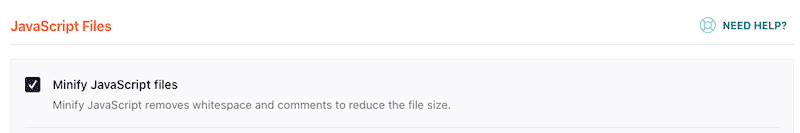
4. Minify JS
Minifying your code means removing any clutter and useless punctuation: new lines, spaces, etc. You may always have some sort of content that is not required and consumes a lot of time, hindering your webpage from loading. By eliminating such ‘dead code’ from your script, you free up time for the main thread to focus on many important tasks.
Lighthouse issue from the diagnostic section: It addresses the “Reduce JavaScript Execution Time“, “Minimize main thread work” and “Minify JS” recommendations.
✅ Manual Solutions:
- Do a backup of your site, or do not edit your JS files directly in a production server.
- Use a text editor like Sublime Text or Visual Studio Code. We don’t recommend editing your code using Google Docs, for example — it adds some extra formatting.
- Open the file containing your code and remove the comments, white space, new lines, and indentations. Don’t forget to shorten ID, class, or variable names as much as possible and optimize your conditional statement.
✅ Use a WordPress plugin:
- Closure Compiler by Google itself! It helps with the JS compression.
- Autoptimize plugin can also help you minify JS.
- WP Rocket allows you to minify your JS files in one click.
5. Use GZIP Compression
GZIP compression enables your code to be compressed so that the files sent from the server to the visitor’s browser are smaller (and your website faster!) You can picture all your HTML, CSS and JS compressed together to obtain a smaller file, reduce TBT, and consequently increase performance.
Lighthouse issue from the diagnostic section: It addresses the “Enable text compression” recommendation.
✅ Use a WordPress plugin:
- Enable GZIP Compression plugin gives you the possibility to enable and disable Gzip compression on your WordPress site.
- WP Rocket enables GZIP compression automatically. You can read more about GZIP compression in our documentation.
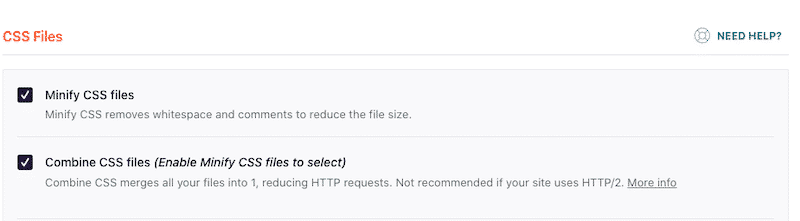
6. Minify CSS Files
This lowers your file sizes by removing comments, redundant code, and whitespaces. The idea is that you want to reduce as much time as possible, and these traits are not necessary to run the page. Doing so will reduce CSS load and overall parsing time.
Lighthouse issue from the diagnostic section: It addresses the “Minimize main thread work” and “Minify CSS” recommendations.
✅ Manual Solutions (for more details, please refer to the JS section above):
- Do a backup of your site, or do not edit your CSS files directly in a production server.
- Use a text editor like Sublime Text or Visual Studio Code.
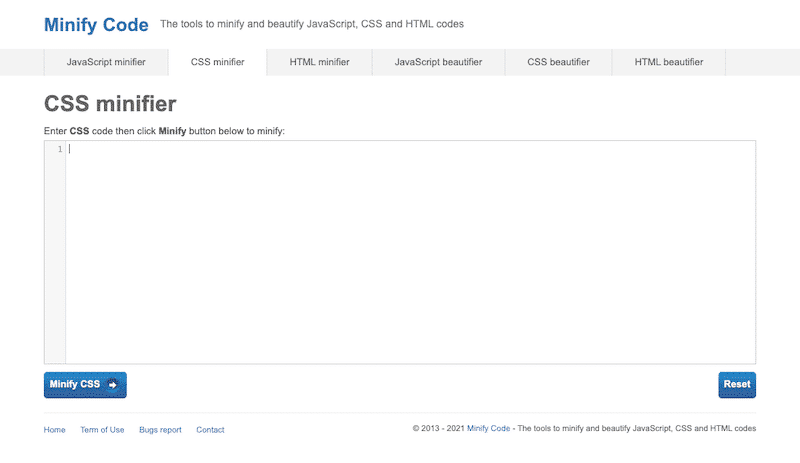
✅ Using a web tool:
- Go to minifycode.com and click the CSS minifier tab.
- Paste the CSS code into the input box and click the Minify CSS button.
✅ Use a WordPress plugin:
- Autoptimize
- WP Super Minify
- CSS Nano
- WP Rocket cache plugin which helps you minify your CSS in one click:
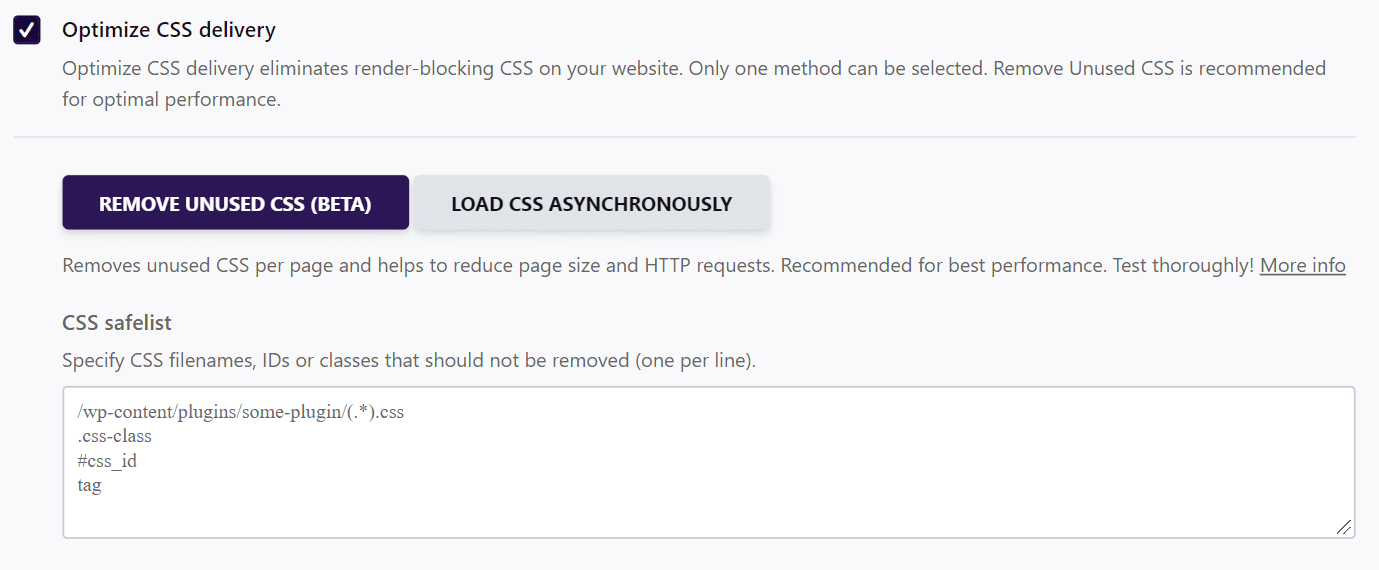
7. Optimize CSS Delivery
Minimizing the main thread frees up your browser to handle other tasks required for the web page to run efficiently. Some events, such as CSS parsing, can block the main thread from handling other tasks and processes. Therefore, it’s essential to optimize the way CSS is delivered.
Lighthouse issue from the diagnostic section: It addresses the “Minimize main thread work” recommendation.
✅ Manual Solutions:
- Combine and compress your CSS scripts
- Prioritize CSS rules for the above-the-fold content
- Avoid using STYLE tags in the HTML body
✅ Use a WordPress plugin:
- The WP Rocket cache plugin helps you optimize your CSS delivery in one click, thanks to the Remove Unused CSS option.
8. Reduce Server Response Time and Time to First Byte (TTFB)
Your server needs to be fast, and your TTFB needs to be optimized to improve the TBT score.
Lighthouse issue from the diagnostic section: It addresses the “Reduce initial server response time” recommendation.
✅ Use an advanced cache plugin and a CDN:
How to Fix the TBT Score With WP Rocket
As mentioned previously, the execution of JavaScript is the most important factor that affects the TBT metric. By delaying and deferring JavaScript using WP Rocket, you’ll give your WordPress site a little speed boost.
You can use several WP Rocket features to reduce the impact of TBT and improve its score.
Let’s take a look at a case study.
Running the PageSpeed Insights Audit
We’ve audited the website of a French caterer named “Le point Gourmand…” using Google PageSpeed Insights.
Let me share with you what we did to get the following performance results:

Lighthouse’s score before WP Rocket: 51/100
- In orange: TBT was 480 ms and TTI 7,0 s
- In red: Speed Index was 6,0 s and LCP 7,1 s
Lighthouse’s score after using WP Rocket: 95/100
- In orange: Only the LCP needs to be fixed, but we can notice that it has significantly improved.
- In Green: Speed Index, FCP, TTI, CLS, and… TBT!
The diagnostic and opportunities sections were not so great when I performed my first audit without using the WP Rocket cache plugin. The issues found by Lighthouse were impacting my TBT and my global performance score.
As seen previously, the TBT score is mainly impacted by issues like messy and unused JS, a high JS Execution time, high main-thread work, and a third-party code that takes up all the resources.
According to the audit, my website was not in very good health, and many JS/main-thread issues were found:
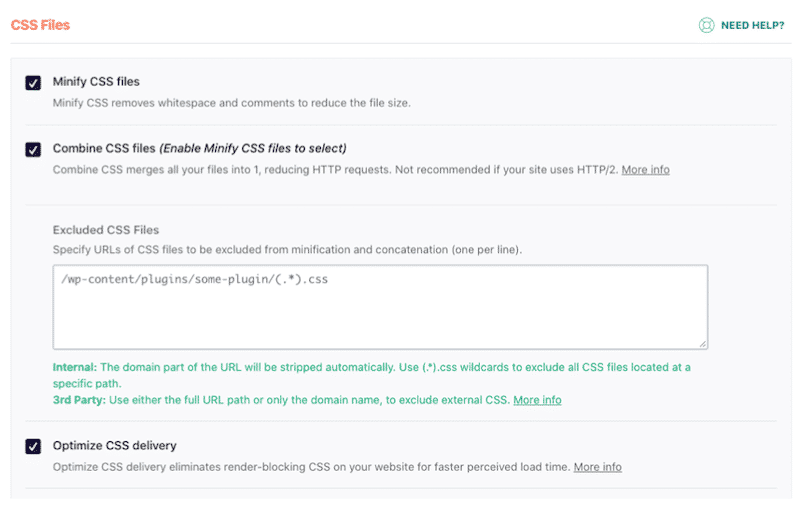
Enabling the WP Rocket Features
Upon activation of WP Rocket, I went to the settings section of my WordPress site, and I made sure to activate the following options:
1. Optimization of JS files (Defer and Delay)
2. Optimization of CSS files
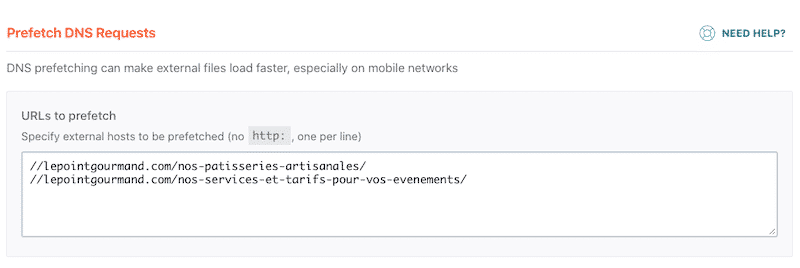
3. URLs to prefetch
I’ve added a couple of URLs to prefetch, and it increased my score again:
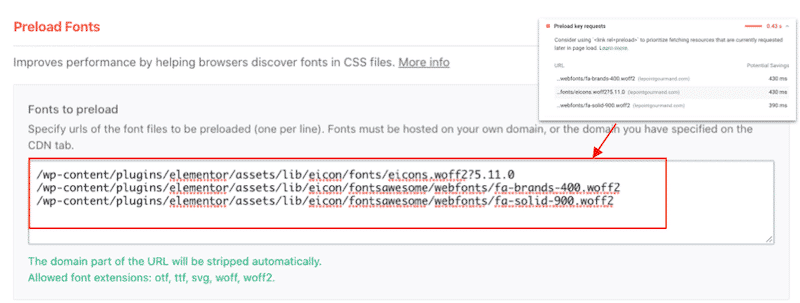
4. Preload fonts
Lighthouse also found a performance issue regarding the fonts and the icons used on the website. I fixed it using the WP Rocket “Preload fonts” tab:
- Expand the “Preload Key Requests” section in PSI to identify the URLs containing the issues.
- Copy the URLs provided by Lighthouse.
- Paste them in the “Preload Fonts” section in your WP Rocket dashboard.
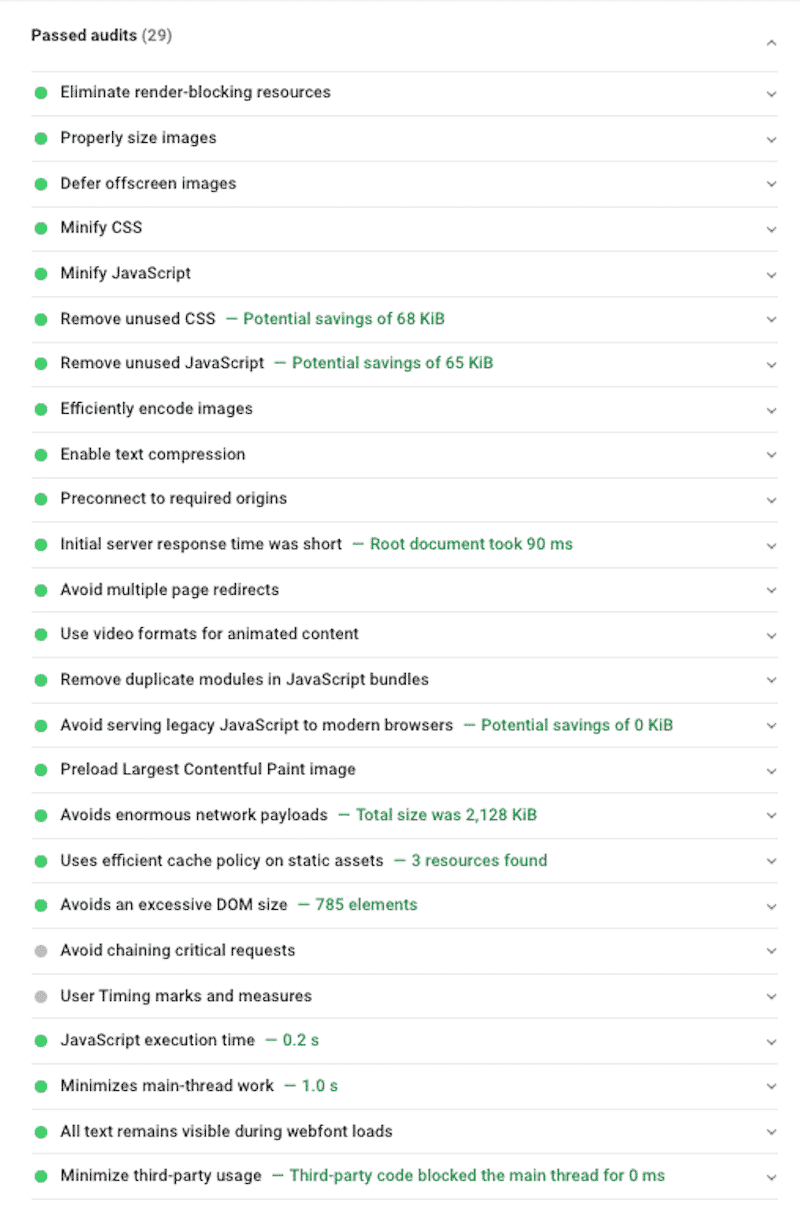
Achieving Excellent Performance Results
Finally, my “Passed audits” list has significantly grown, and some issues like “Minify JS”, “Minimize main-thread works,” “Remove unused JS” or “Eliminate render-blocking resources” are gone thanks to WP Rocket.
I’ve summarized my audit in the table below to highlight the main challenges overcome:
| Lighthouse recommendations that impact the Total Blocking Time | Can it be solved by WP Rocket? |
| JS related issues: Eliminate render-blocking resources and Remove unused Javascript | Yes – In a few clicks, you’ll defer and delay JS and clean up the code. |
| Minify CSS and Optimize CSS delivery. | Yes – By minifying CSS and use the Optimize CSS Delivery option, you’ll address the PSI recommendations. |
| Minify third-party usage and Preconnect to required origins | Yes – You can use the Prefetch DNS feature. |
| Reduce JS Execution Time | Yes – In a few clicks, you’ll minify, delay, and defer JavaScript and improve JS execution time. |
| Minimize main-thread work | Yes – By deferring, delaying, and minifying JS and CSS, you’ll take care of the PSI recommendation. |
| Reduce initial server response time | Yes – By using caching and a CDN, you’ll reduce the Time to First Byte. |
Wrapping Up
Hopefully, this guide has helped you to understand how to optimize your TBT score for your WordPress site using some concrete steps.
Total Blocking Time is an important user-centric performance metric as it counts for 30% of the Lighthouse performance grade. A slow website can drive away potential visitors and customers, hurt your site’s User Experience (UX), and even impact your SEO.
The easiest and most convenient way to get a great TBT score is by installing WP Rocket which applies 80% of web performance best practices right upon activation.
You can always count on our 100% money-back guarantee. Although we don’t think you’ll ever want one, we’ll gladly provide a refund if you request it within 14 days of purchase.
🚀 The only risk you’ll be taking with our plugin is speeding up your website!