
Redis Full-Page Cache vs NGINX FastCGI Cache for WordPress
Table of Contents
Caching is the backbone of website speed and performance. It’s critical to your WordPress site’s success. Even if your site is hosted on a hefty server, it’ll come to a crawl if you don’t have any caching enabled. Serving websites to tens of thousands of users per day is possible only because of smart caching techniques.
In this article, I’ll pit two distinct WordPress page caching solutions against one another. While NGINX FastCGI Cache is a tried and tested page caching veteran, Redis Full-Page Cache is relatively obscure.
Who will come out on top and who will crumble under the load first? As you’ll soon find out, they both have their pros and cons, but there’s only one winner.
Buckle up. Let’s zoom in!
WordPress Caching 101
WordPress requires many moving parts to work. Every time a user requests a page from a WordPress site, the request is first parsed by the server. If the server cannot serve the requested page readily, it’ll process the relevant PHP scripts and assemble the page dynamically. Sometimes, this also involves querying the database to gather additional data.
As a general rule, the longer the request has to travel, the slower the server’s response. If there are a lot of concurrent users, the server can freeze trying to process all the parallel requests.
Caching helps to speed up server response by storing and delivering previously processed requests. A server can deploy many caching layers to store distinct types of data.
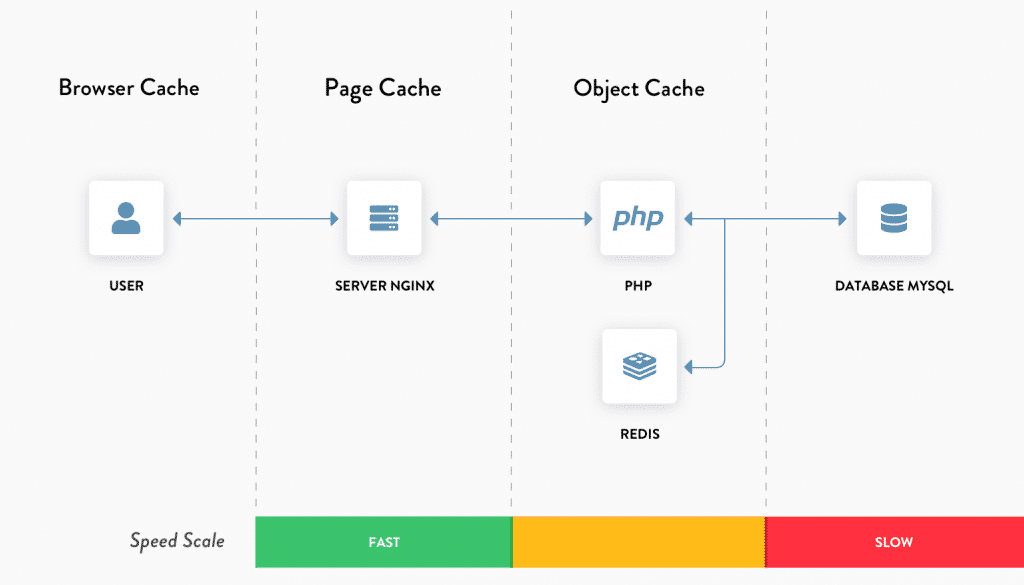
For PHP and database based applications such as WordPress, there are four major types of server-side caching solutions: Object Caching, Page Caching, Opcode Caching, and CDN Caching. You can read more about all of them in WP Rocket’s in-depth article on object caching.
This article focuses on comparing page caching solutions, but I suggest you get familiar with the basics of object caching too.
Setting Up the Test Site and Server
I’ll use a $10 standard droplet from DigitalOcean to conduct the tests. With a decent mix of memory and compute resources, it’s a perfect server to test the WordPress site. The droplet configuration includes 2 GB RAM, 1 CPU, 50 GB SSD Storage, and 2 TB transfer.
I’ve installed the test WordPress site on a Debian-based LEMP stack (Linux, NGINX, MariaDB and PHP 7.3). To stress the test site, I’ve customized it to include a decent mix of static and dynamic elements using WooCommerce and Elementor.

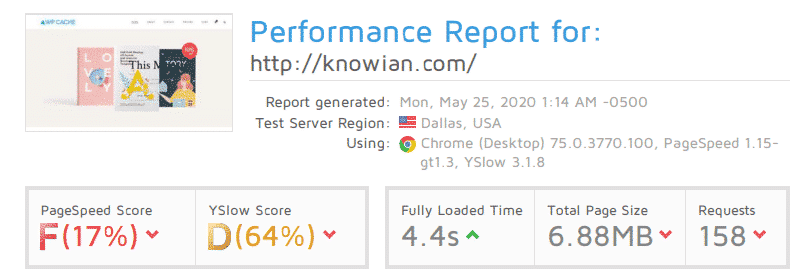
I tested the base site with the GTmetrix website speed testing tool. As you can see from its test report, it’s not yet optimized for performance.
Stress Testing the Base Site with No Cache Enabled
I’ll use a free performance testing tool called loader.io to stress test the website. Their free tier allows you to test two URLs of any website with up to 10000 concurrent clients for a minute. That’s more than enough for our use case.
Note: If you’re wondering about the domain name, it’s an unused personal domain. It’s essential to have the site hosted on an actual domain to install an SSL certificate from a signing authority such as Let’s Encrypt. With an SSL certificate installed, the site has to perform an HTTPS handshake for every unique client request. This mimics real-world usage better during the stress test.
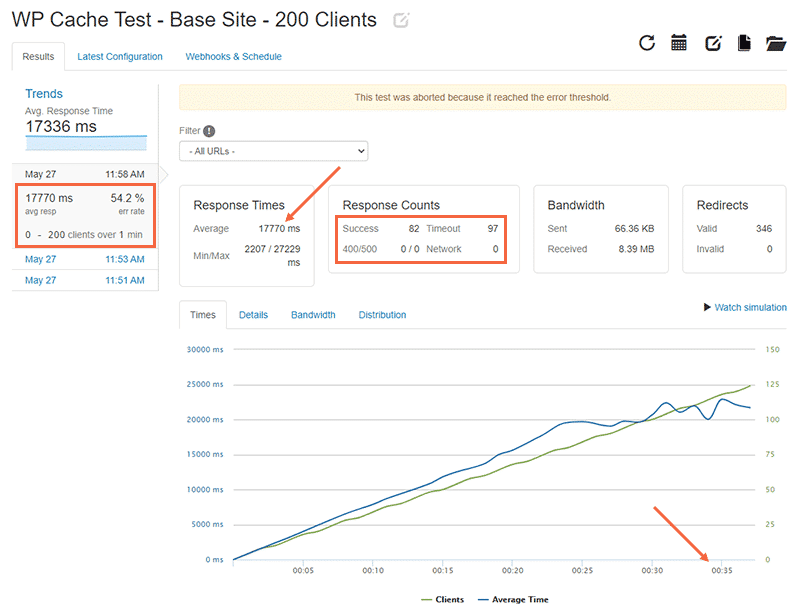
You can check the test parameters inside the orange box on the left side. Note the 0 to 200 clients over 1 min test parameter. This means that loader.io will stress test the website by slowly increasing the number of active clients from 0 to 100 over a 1 minute period.
In the graph shown, the green line represents the number of concurrent clients and the blue line represents the average server response time. You can see that the response time creeps upwards as the number of clients increases.
Loader.io aborted the test after 36 seconds as more than 50% of the requests weren’t successful (a timeout or an HTTP 400/500 error response). Also, the 17.33 seconds average response time doesn’t bode well for the user experience either.
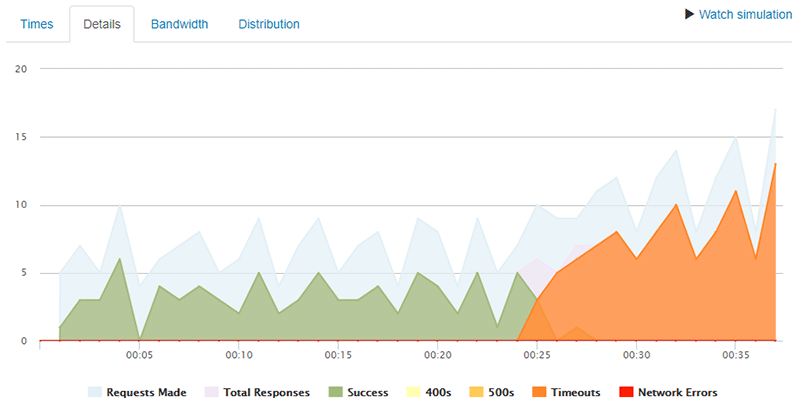
Checking the Details tab will give you a better understanding of when the server timeouts start. You can see that it starts at the 25-second mark.
I ran the test again, this time limiting the number of concurrent clients to 100. The base site struggled to perform even under this minimal load.
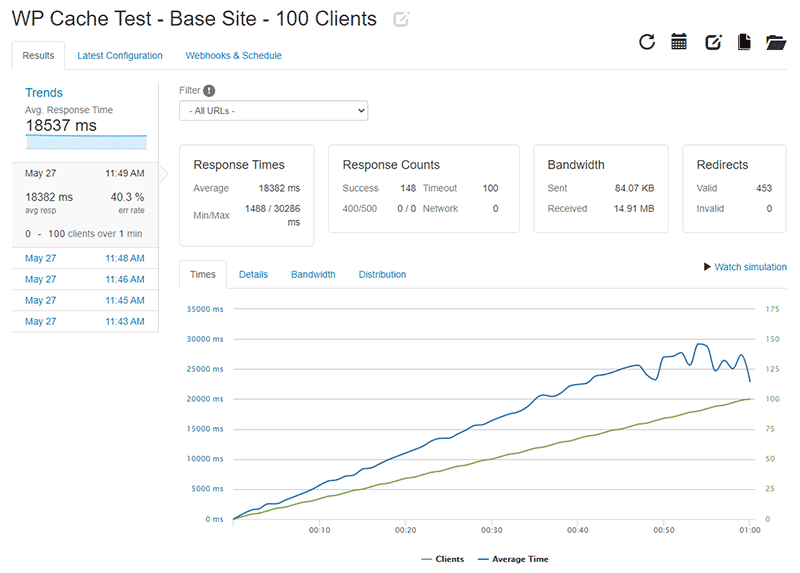
The test ran for a full minute this time around, but the average server response time is still unacceptable. Every active user stresses the server more, which makes it respond slowly to all the other users. The server timeouts still persist.
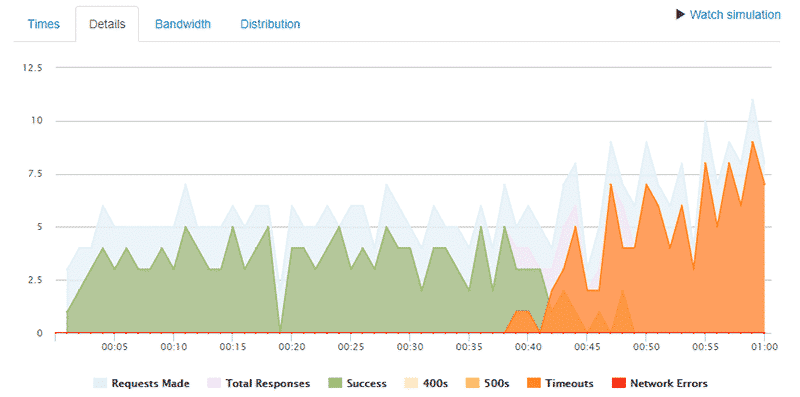
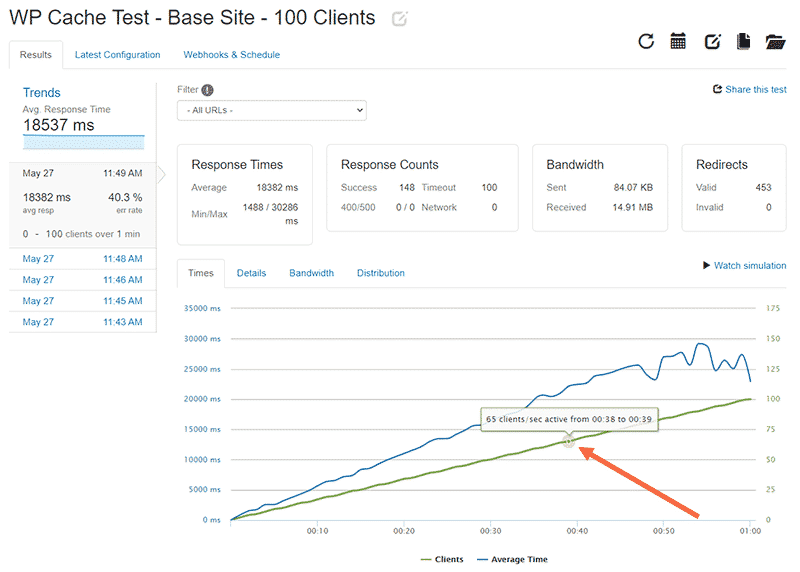
From the above graph you will notice that server timeouts start to occur at the 38 second mark in the test.
Now you have a fair idea of how the base site performs when there are 100 and 200 active clients. It’s time to perform the same tests with Redis Page Cache or NGINX FastCGI Cache enabled on the server.
What is Redis Full-Page Cache?
Redis (Remote Dictionary Server) is an extremely fast in-memory data store for a database, cache, proxy, and more.
Since Redis stores its data in-memory, as opposed to traditional databases that store data on physical disks or SSDs, Redis can seek and deliver data super fast.
As in-memory storage is costlier to scale on a web server, Redis is ideal for caching smaller files such as database query results and persistent sessions. Thus, Redis is typically used to enable object caching and not page caching.
The smart folks over at Pressjitsu adapted the unique features of the Redis server and implemented a Redis-backed page caching solution for WordPress. It uses Redis’ maxmemory #mb and maxmemory-policy allkeys-lru directives to ensure that the server utilizes its limited volatile memory efficiently by removing older cached pages to make room for fresh ones.

Redis Page Cache stores and serves the full-page cache from in-memory store, just like how Redis Object Cache works. Technically, this should make it a highly fast cache.
How to Enable Redis Page Cache
The documentation to enable the Redis Page Cache plugin is a bit inconsistent. After some trial and error, I got it working on my setup. Here are the steps I followed:
1. Before installing the plugin, make sure you have the Redis server installed and running on your web server. If you’re using Debian/Ubuntu, here’s the command to install it via terminal:
sudo apt-get install redis-serverI highly recommend you to follow Digital Ocean’s tutorial on installing and securing Redis on your Linux distro. If you have any other variant of Linux, they also have separate tutorials catering to almost every major Linux distro.
2. Once you’ve installed and configured Redis on your web server, you need to install the PhpRedis extension on your server. It provides an API for PHP to communicate with the Redis key-value store.
sudo apt-get install php-redisRestart your PHP server after installing the PhpRedis extension. You can do it with the following command:
sudo service php7.3-fpm restartNote: My web server runs PHP 7.3 version. You need to use a command corresponding to your web server’s PHP version.
3. You need to ensure that the Redis server has enough memory allocated to store the page caches. Redis Page Cache recommends that you allocate at least 16 MB just for page caching. You can do this by adding the following line to your redis.conf file:
maxmemory 256mbI’ve allocated 256 MB to the Redis server. Since the plugin compresses the cache using gzip to lower memory usage, it should be more than enough to store all the page caches.
Next, add the following memory policy to ensure that Redis evicts older caches to make room for fresh ones.
maxmemory-policy allkeys-lruRestart the Redis server after saving your changes in the configuration file. Here’s the command to restart Redis:
sudo systemctl restart redis.service4. Now you need to install and activate the Redis Page Cache plugin. You can either install it manually from its open source GitHub repository or directly via WordPress.org.
Note: If you install the plugin directly via WordPress.org, the plugin’s slug (or its directory name) is pj-page-cache-red. But if you download it directly through its GitHub repo, the slug is redis-page-cache. Remember where you’ve installed from as you need to use the correct slug in the next step.
5. Next, you need to create
cd /var/www/your-domain.com/wp-contentYou can now create a symlink inside the wp-content directory by using the ln -s command.
sudo ln -s plugins/pj-page-cache-red/advanced-cache.php advanced-cache.php6. Finally, you need to enable page caching in your WordPress site by editing its wp-config.php file.
Add the following code snippet above the line that says /* That’s all, stop editing! Happy blogging. */
define( 'WP_CACHE', true );Note: The location where you add the above code snippet is very important.
You’ve finished setting up Redis Page Cache for your WordPress site.
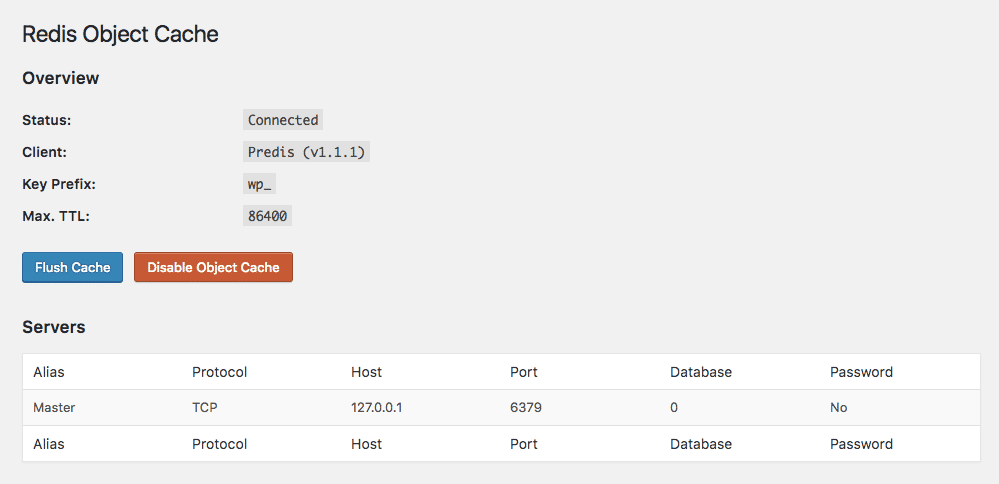
Before load testing the website, let’s check whether the page cache works as intended. You can test this by visiting the site in incognito mode, or by using the cURL command:
curl -v https://example.com -o /dev/nullIf the page cache is working as intended, then you should see an X-Pj-Cache-Status response header with the hit value.
< X-Pj-Cache-Status: hitIf the value shown is “miss” the first time around, try running the command again or refreshing the page. You need to do this as the cache gets saved only after the page has been loaded at least once.
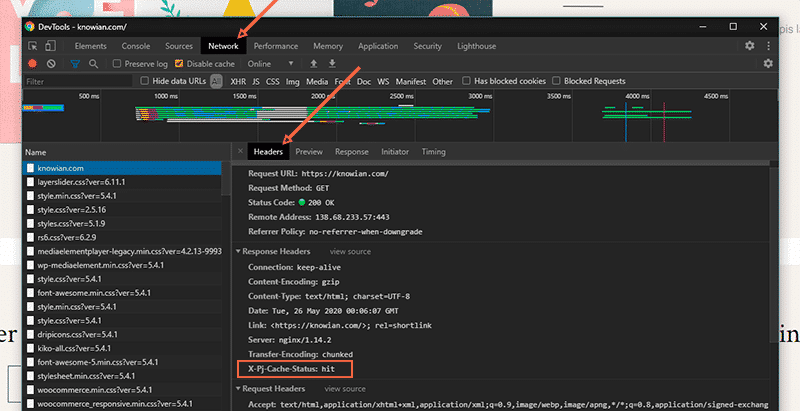
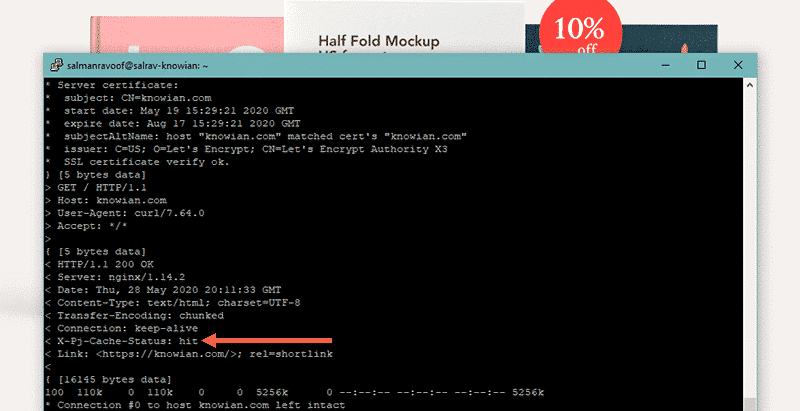
Congrats, you’ve now verified that Redis Page Cache is working on your website.
You can also configure the Redis Page Cache plugin to define how it should work. For this example, I’ll stick to the default settings.
Stress Test with Redis Page Cache Enabled
Let’s stress test the dummy site to see how it holds up with Redis Page Cache enabled. I’ll fire up loader.io and perform the load test with the maximum number of concurrent clients set to 100.
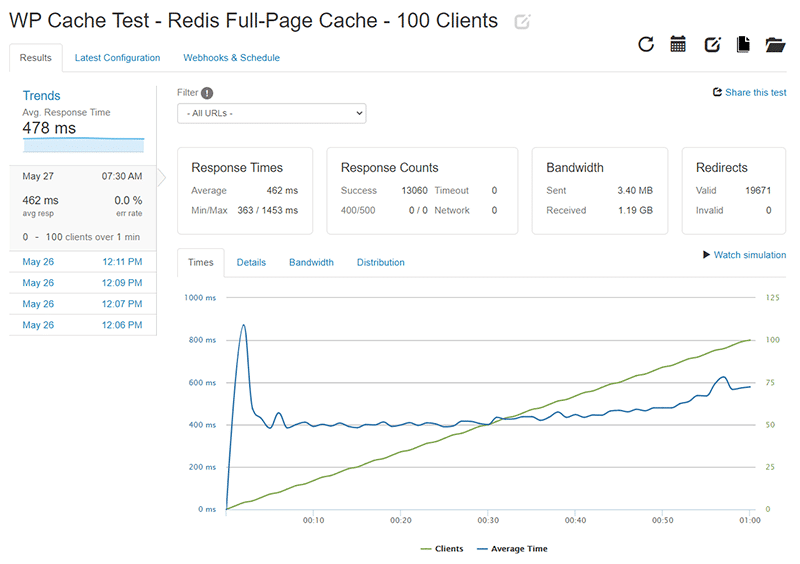
I repeated the test five times to ensure that the results are consistent. With an average response time of 478 ms and no errors, we can conclude that the site works splendidly with the page cache enabled.
As the number of concurrent clients increases (the green line), the response time stays relatively constant (the blue line). That’s one of the best indicators that a server can handle many active users without affecting page load speed.
Let’s perform the test again, but this time with a maximum of 200 concurrent clients.
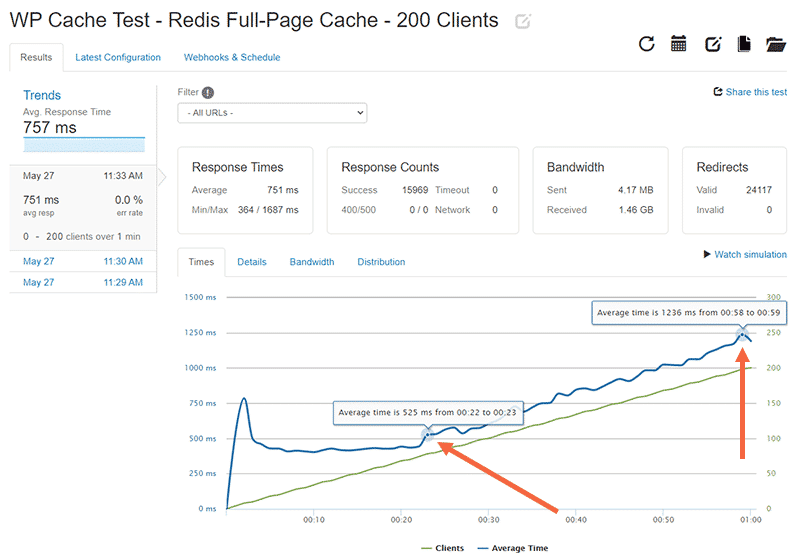
The site still performs well with no errors and an average response time of 757 ms.
In the graph above, you’ll notice a spike in response time at the 22-second mark. After this point, the server response time climb upwards as the number of active clients increases. According to a study by rackAID, you need to keep your server response time less than 500 ms to maintain a good user experience.
At the end of the test with 200 active users, the server response time climbed to over 1200 ms. That’s far from ideal.
Note: Caching is just one of the many ways to reduce server response time. For more information on this topic, refer to WP Rocket’s article on reducing TTFB.
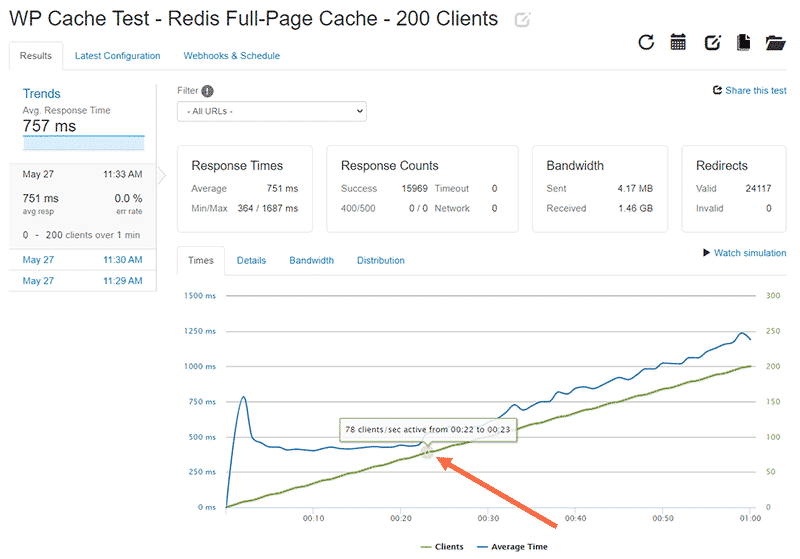
Serving 78 concurrent clients with no performance loss is excellent. Assuming that every user spends an average of 2 minutes on any page, it translates to serving over 1.5 million page requests every month facing no server hiccups.
Let’s push the server’s limits more. I’ll stress test it again with the maximum number of active clients set to 250.
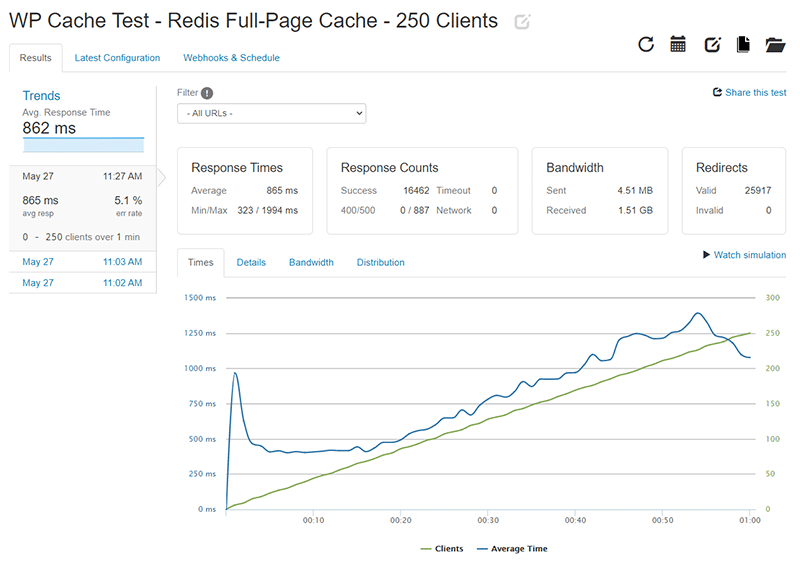
The results look consistent with the previous test, but this time 5.1% of the server’s responses were HTTP 400/500 errors. Looking at the Details tab will give us more information about when the error responses first occurred.
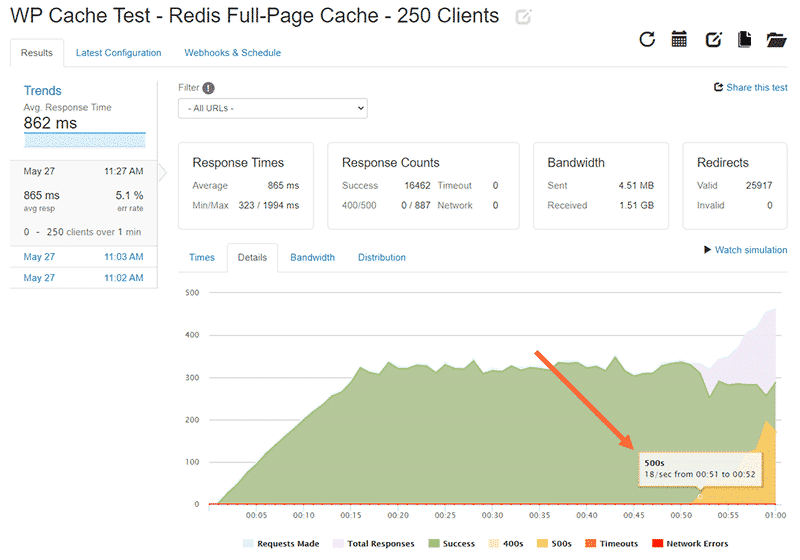
The HTTP 500x errors first occurred at the 51 second mark. The total number of active clients was 218 in the test.
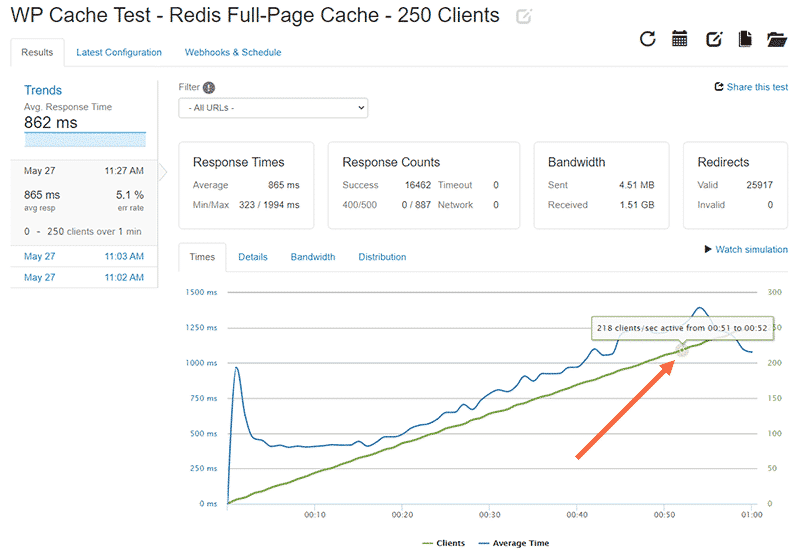
The data points above will give you a fair idea of how many active clients the site can handle without errors.
From the above tests we can conclude that Redis Page Cache improves the performance of the site considerably. Now let’s move on to testing the site with NGINX FastCGI Cache enabled.
What is NGINX FastCGI Cache?
NGINX is a popular, high-performance web server that can host WordPress sites. Apart from being a web server, it’s also used as a reverse proxy, mail proxy, load balancer, and HTTP cache.
As per W3Techs, 32.1% of websites are installed on an NGINX web server (May 25, 2020). Most performance-focused WordPress hosts use NGINX to power their websites today.
Caching on NGINX is mainly powered by its FastCGI Cache module. According to a benchmarking test done by SpinupWP, NGINX FastCGI Cache was the fastest and the most efficient caching solution of the lot.
How to Enable NGINX FastCGI Cache
You can only enable NGINX FastCGI Cache on a web server that has NGINX installed. Since I’ve already installed NGINX as my webserver, I’ll just reset it to its base configuration to remove any traces of Redis.
You can learn how to use NGINX FastCGI Cache on your WordPress site by visiting WP Rocket’s article on NGINX caching. You can also check out our Caching Dynamic Content in WordPress article for an in-depth tutorial on how to enable NGINX FastCGI Cache.
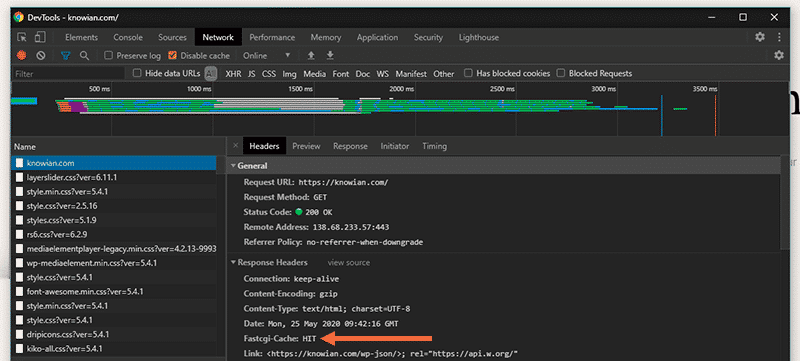
Before stress testing the site, let’s verify that FastCGI Cache works on the site by checking its response headers.
Now let’s move ahead with the stress test on loader.io.
Stress Test with NGINX FastCGI Cache Enabled
First, I’ll test the site by setting the maximum number of active clients to 100.
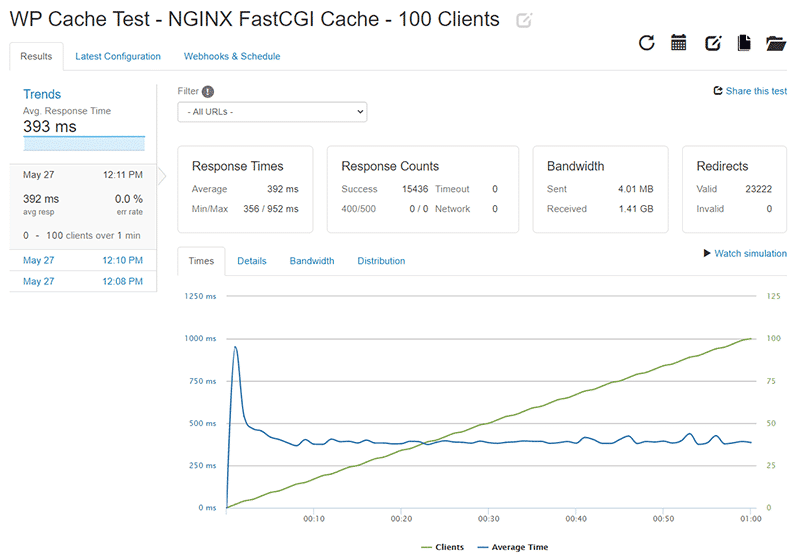
As expected, the site performs exceptionally well after enabling page cache. The average server response time stays below 400 ms even as the number of active clients reaches 100 (the maximum number set by me).
Now let’s increase the maximum number of active clients to 200 and repeat the stress test.
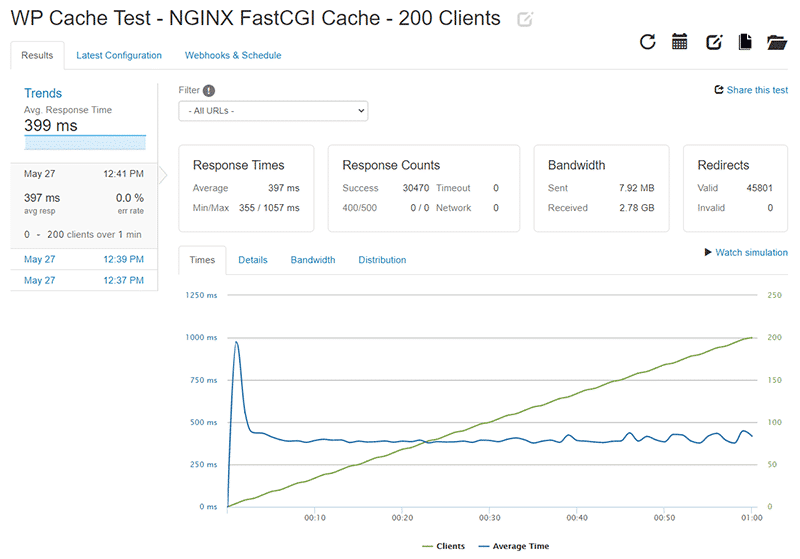
Even after increasing the max number of active clients, the average server response time still stays below 400 ms. We already have a clear winner.
But how far can we push the server? Loader.io allows you to set the maximum number of active clients to a whopping 10000. So, I tested with this max setting to see whether the server will keep up.
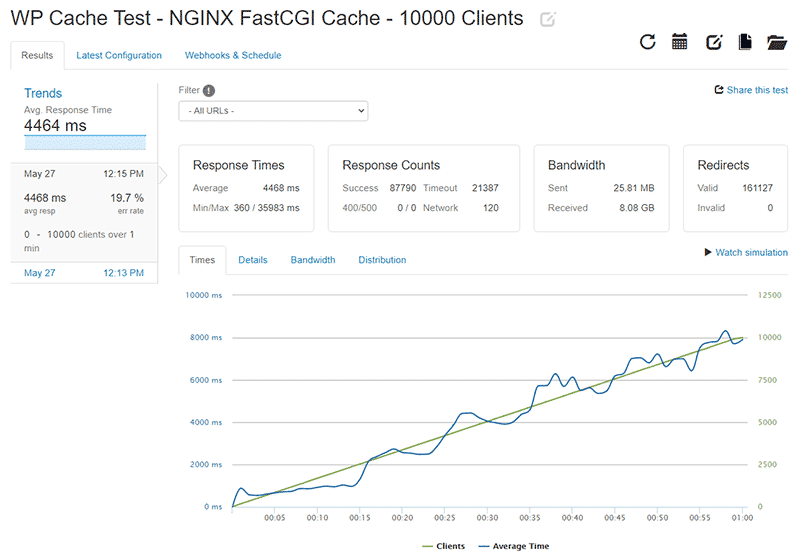
Surprisingly, the server kept up. However, the test results showed a 19.7% error rate (timeouts in this case) and an average server response time of 4464 ms.
I kept reducing the max number of clients by half to find out the site’s stress limit with NGINX FastCGI Cache enabled. Finally, I arrived at two numbers.
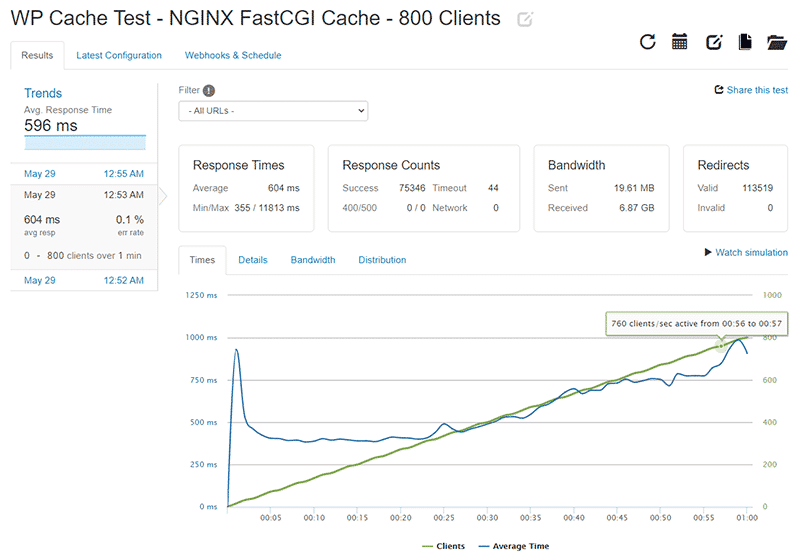
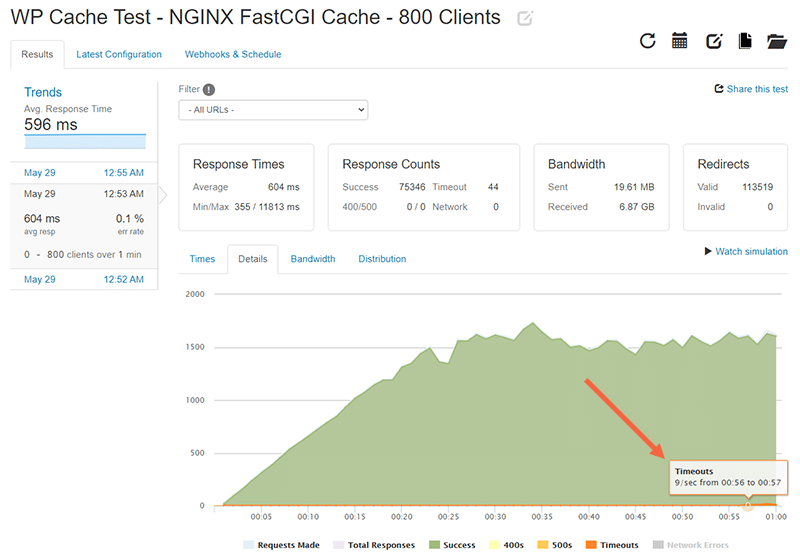
With the max number of active clients set to 800, the average server response time is 596 ms. However, the server timeouts start towards the end of the test after reaching 760 active clients. The stress limit for NGINX FastCGI Cache is 3.5x times that of what we observed with Redis Page Cache.
I’ll perform another stress test to find the number of active clients the server can handle without compromising on average response time (<500 ms). For this test, I’m setting the max number of concurrent clients to 500.
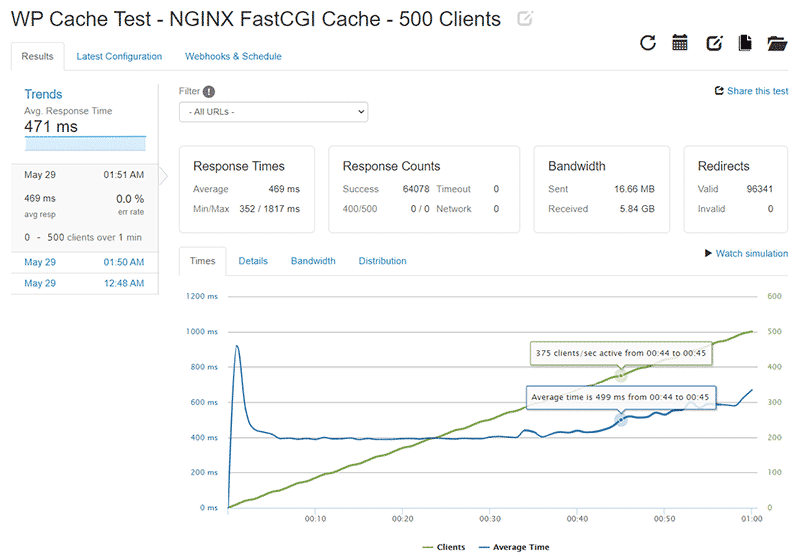
The server’s response time reaches over 500 ms at the 44 second mark and keeps moving upwards. The number of active clients at this point is 375. Hence, we can deduce that the server can handle 375 concurrent clients without affecting the response time. That’s 4.8x times the number of active clients supported by Redis Page Cache.
Assuming that every user spends an average of 2 minutes on any page, it translates to serving 8.1 million page requests every month facing no server hiccups. Not bad for a site hosted on a $10/month server.
Summing Up The Stress Tests
Redis Page Cache is a smart implementation of full-page caching for WordPress sites. Compared to having no page caching enabled, it helps improve the site performance considerably.
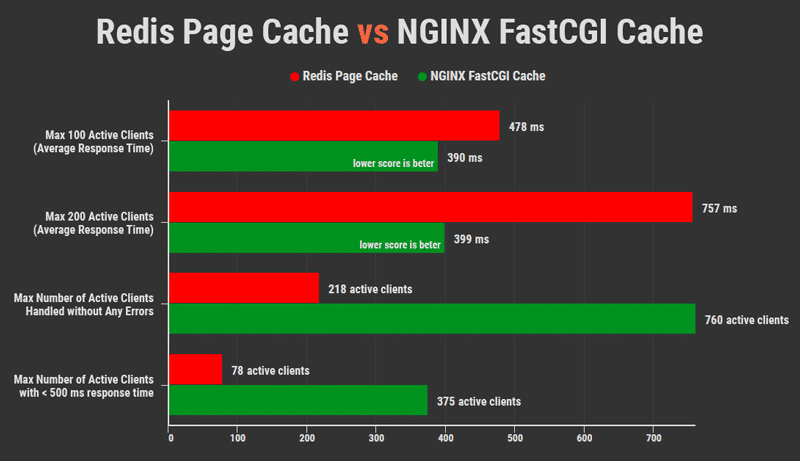
However, NGINX FastCGI Cache beat Redis Page Cache in all the stress tests performed. Below is a comparison chart of both their stress tests. The results are conclusive and speak for themselves.
Wrapping Up
You don’t need expensive hosting to optimize your site’s performance if you know how to enable page caching. Almost all managed WordPress hosts do exactly this to speed up WordPress sites.
If you’d like to dive deeper, you can club NGINX FastCGI Cache with Redis object caching to optimize the site’s performance even further. There’s also a custom NGINX configuration for WP Rocket called Rocket-Nginx. It enables NGINX and WP Rocket to serve cached files directly without calling WordPress or running PHP.
Page caching is an excellent choice to speed up your website. Choosing the right page caching solution for your WordPress site can be highly confusing. I hope this article answered some of your doubts.
If you’re still not sure about WordPress page caching or are stuck somewhere, don’t hesitate to leave a comment below!