
Table of Contents
Last update on
Testing your WordPress site’s speed and performance might seem daunting at first, but if you have the right website speed test tools, it really shouldn’t be. Your visitors expect the performance to be top-notch, otherwise, they are just going to click away to something else and all the work you put into designing and creating your site goes to waste.
To make a good first impression and to rank high on Google you really should be focusing on optimizing your website loading time and performance as much as possible.
Let me tell you a short story that became the first golden rule I give to all of my clients as a marketing consultant.
A couple of years ago, I suggested testing the performance of our online shop to my CEO. He said that the website seemed to be fast enough on his computer, therefore we did not need to run any tests. That was of course a mistake because when you visit your own website very frequently, browsers like Chrome actually save the content to pre-load it for the next visit.
We explained to him that with the right tools, a performance test could be easy (and free) to perform.
We ended up conducting the test and we found room for improvement and particular optimizations that made us improve the overall user experience of our shop!
| 🚀 The first golden rule: always test the speed of your WordPress site as part of your WordPress pre-launch checklist. Don’t assume that you have a fast website just because it loads instantly on your computer. Keep in mind that a regular visitor coming for the first time may not have the same experience as you do. |
If you are curious to know how your website is performing, keep reading. We are going to show you how to test your WordPress site with the most popular speed tools and how to interpret the metrics of the performance results.
You can watch our video to learn everything you should know about measuring the speed of your site, or you can keep reading the article to learn more.
5 (+1) Web Performance Tools to Test the Speed of Your Website
When you’re creating a website, maybe migrating it from a CMS like SquareSpace to WordPress, and launching it to the world, you’ve got very little room for error. But don’t worry, there is a wide range of tools out there that all aim to measure site speed and page loading time. We’ve pulled out the top 5 to get you started:
- GTmetrix is a tool that analyses your site specifically for speed-related optimization opportunities.
The statistics it generates are incredibly useful to monitor when your pages are slow, and when you track them over time, you get some really interesting patterns that can help you optimize how your site is running.
💡If you’re using WP Rocket, you can now access performance insights directly inside WordPress with Rocket Insights, the built-in performance hub. It brings performance monitoring where you already optimize your website speed, so you can track your key pages, see your performance at both page and global level, and understand what’s affecting your results.
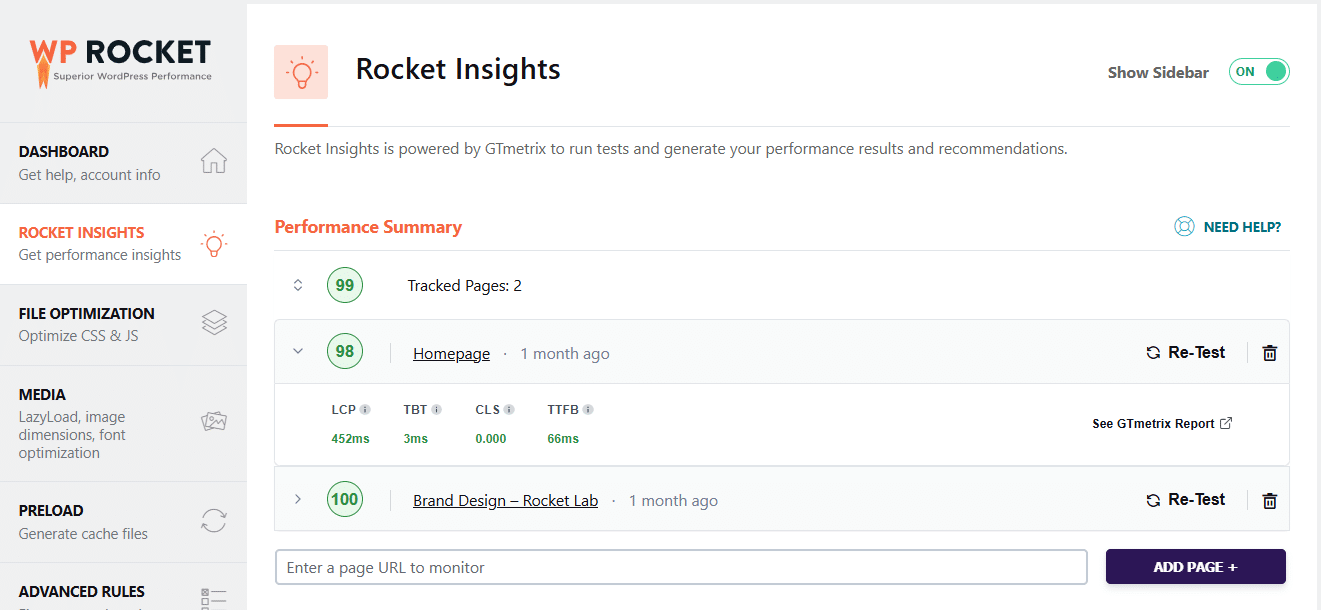
With Rocket Insights, you can also get clear recommendations on which WP Rocket features to enable, helping you move from insights to action without guesswork.
To start using it, simply update WP Rocket to the latest version and access Rocket Insights directly from your dashboard. With automatic monitoring and unlimited tests, you can stay in control of your website performance, track improvements over time, and optimize your site more efficiently, all in one place.
- PageSpeed Insights (PSI) is a tool from Google itself that looks at your site, reports on the performance across devices, and then also provides suggestions about how that page can be improved on mobile and desktop.
It collects data in a controlled environment (the lab data), as well as a real-world field environment (the field data) so you have full visibility on your Core Web Vitals and you can prevent any potential problems curtailing online performance and SEO.
- Pingdom provides easy and affordable online experience monitoring, capturing various insights about your site’s availability, performance, and page loading time, so you can take action on potential weak spots.

They offer both synthetic monitoring where visitor interaction is simulated, as well as real user monitoring which gives a more accurate sense of how your site is performing out in the wild. Pingdom generates a performance grade, a total page load time, the total page size, and the number of requests you get on your website.
- WebPageTest allows you to run a free website speed test from around the world across multiple browsers at connection speeds that are typical of your user base.
Once it’s gathered those results, it can make various suggestions to help optimize how your site is running and what you can do to improve things. The specificity you can include when it comes to geography makes this a really interesting and powerful tool.
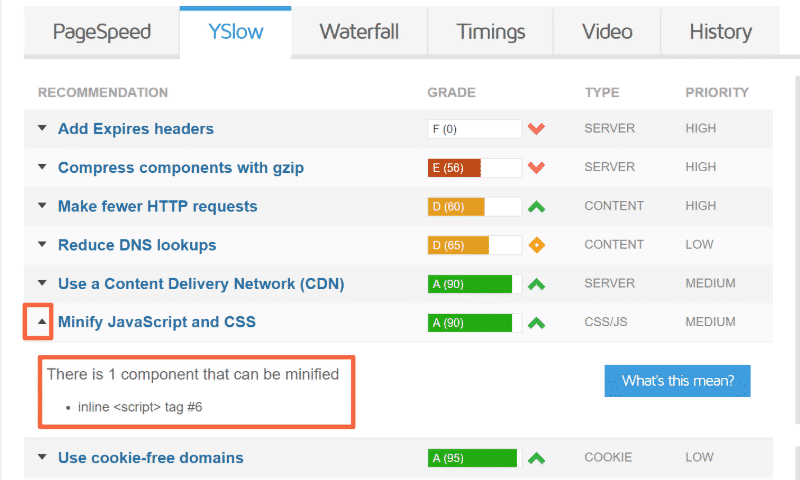
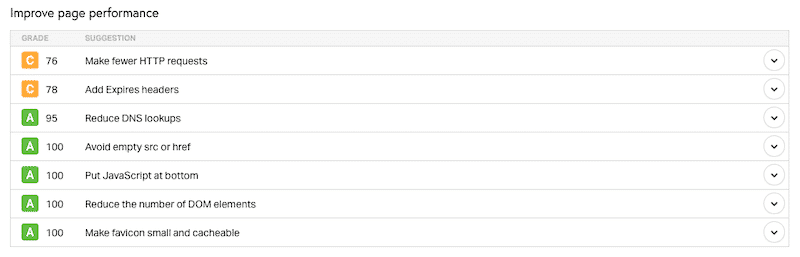
- Yslow is an open-source project that analyses web sites of all types and grades them based on performance and speed. It’s certainly the rawest of the website testing tools, but it has an incredible community of developers behind it and can be useful for spotting some of the more opaque concerns. YSlow works by crawling your website and comparing it against a list of 23 rules, based on Yahoo’s rules for high-performance websites.You can use GTMetrix to see the Yslow score (it’s a grade from A to F).
Understanding the Performance Metrics of your WordPress Site
When using any of these tools, there are some common metrics and other considerations that you should be paying attention to. Let’s dig into the main loading metrics to look at:
- The First Contentful Paint (FCP) marks the first point when a user can see anything on the screen, and it is considered the perceived load speed as a result.
✅ Your FCP score should be less than or equal to 2.5 seconds.

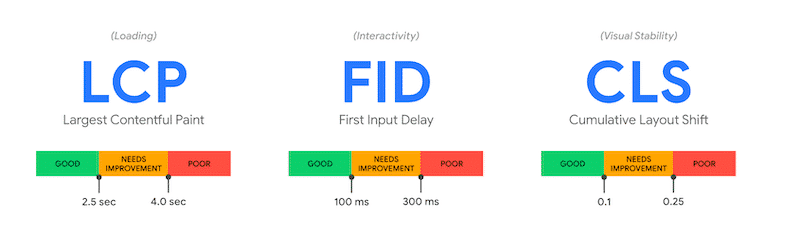
- The Largest Contentful Paint (LCP) is a Core Web Vital metric that measures how long it takes the largest visible element on the site to be rendered.
✅ Your LCP score should be less than or equal to 2.5 seconds.
- The Total Blocking Time (TBT) measures load responsiveness and quantifies the non-interactivity of any specific page before it becomes usable.
✅ Your TBT score should be under 50 ms.
- The Cumulative Layout Shift (CLS) measures how visually stable a page is by quantifying how often users might experience unexpected shifts to the layout. It’s another Core Web Vital metric.
✅ You site should strive to have a CLS score of 0.1 or less.
- The Interaction to Next Paint (INP) is the third Core Web Vital metric and aims to measure the page responsiveness.
✅ A good INP score should be under 200 ms.
- The Time to Interactive (TTI) is a metric that identifies cases where a page seems interactive to a user, but it actually isn’t. The aim here is to minimize the time between the FCP and the TTI.
✅ A page is considered fully interactive when the page responds to user interactions within 50 ms.
- Load Time: how long it takes for your website to finish loading completely.
- Total Page Size: Also called the “page weight”. It’s a term to describe the amount of data on the page. For example, a 7 MB picture can increase the score. This will have an impact on the “fully loaded time” criteria.
- Requests: The number of file requests to display a page.
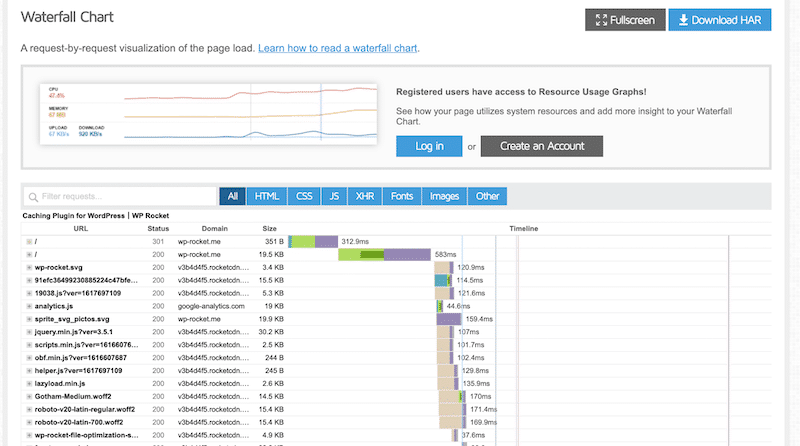
- Waterfall analysis: The request-by-request visualization of the page load:
All of these metrics can be a bit technical, but with the tools we mentioned above, they will often aggregate a lot of this into performance and speed scores, which measure these various components and then grade it against other similar sites to identify where you stack up compared to others.
As such, it’s a good idea to have a basic understanding of these performance metrics, but you can rely on tools to do a lot of the heavy lifting when it comes to the actual measurements and the final diagnostics.
Some of the other considerations that you should think about when using these tools are as follows:
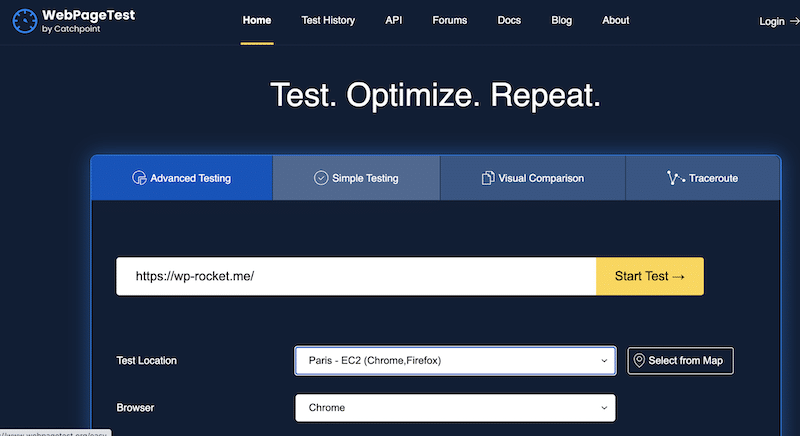
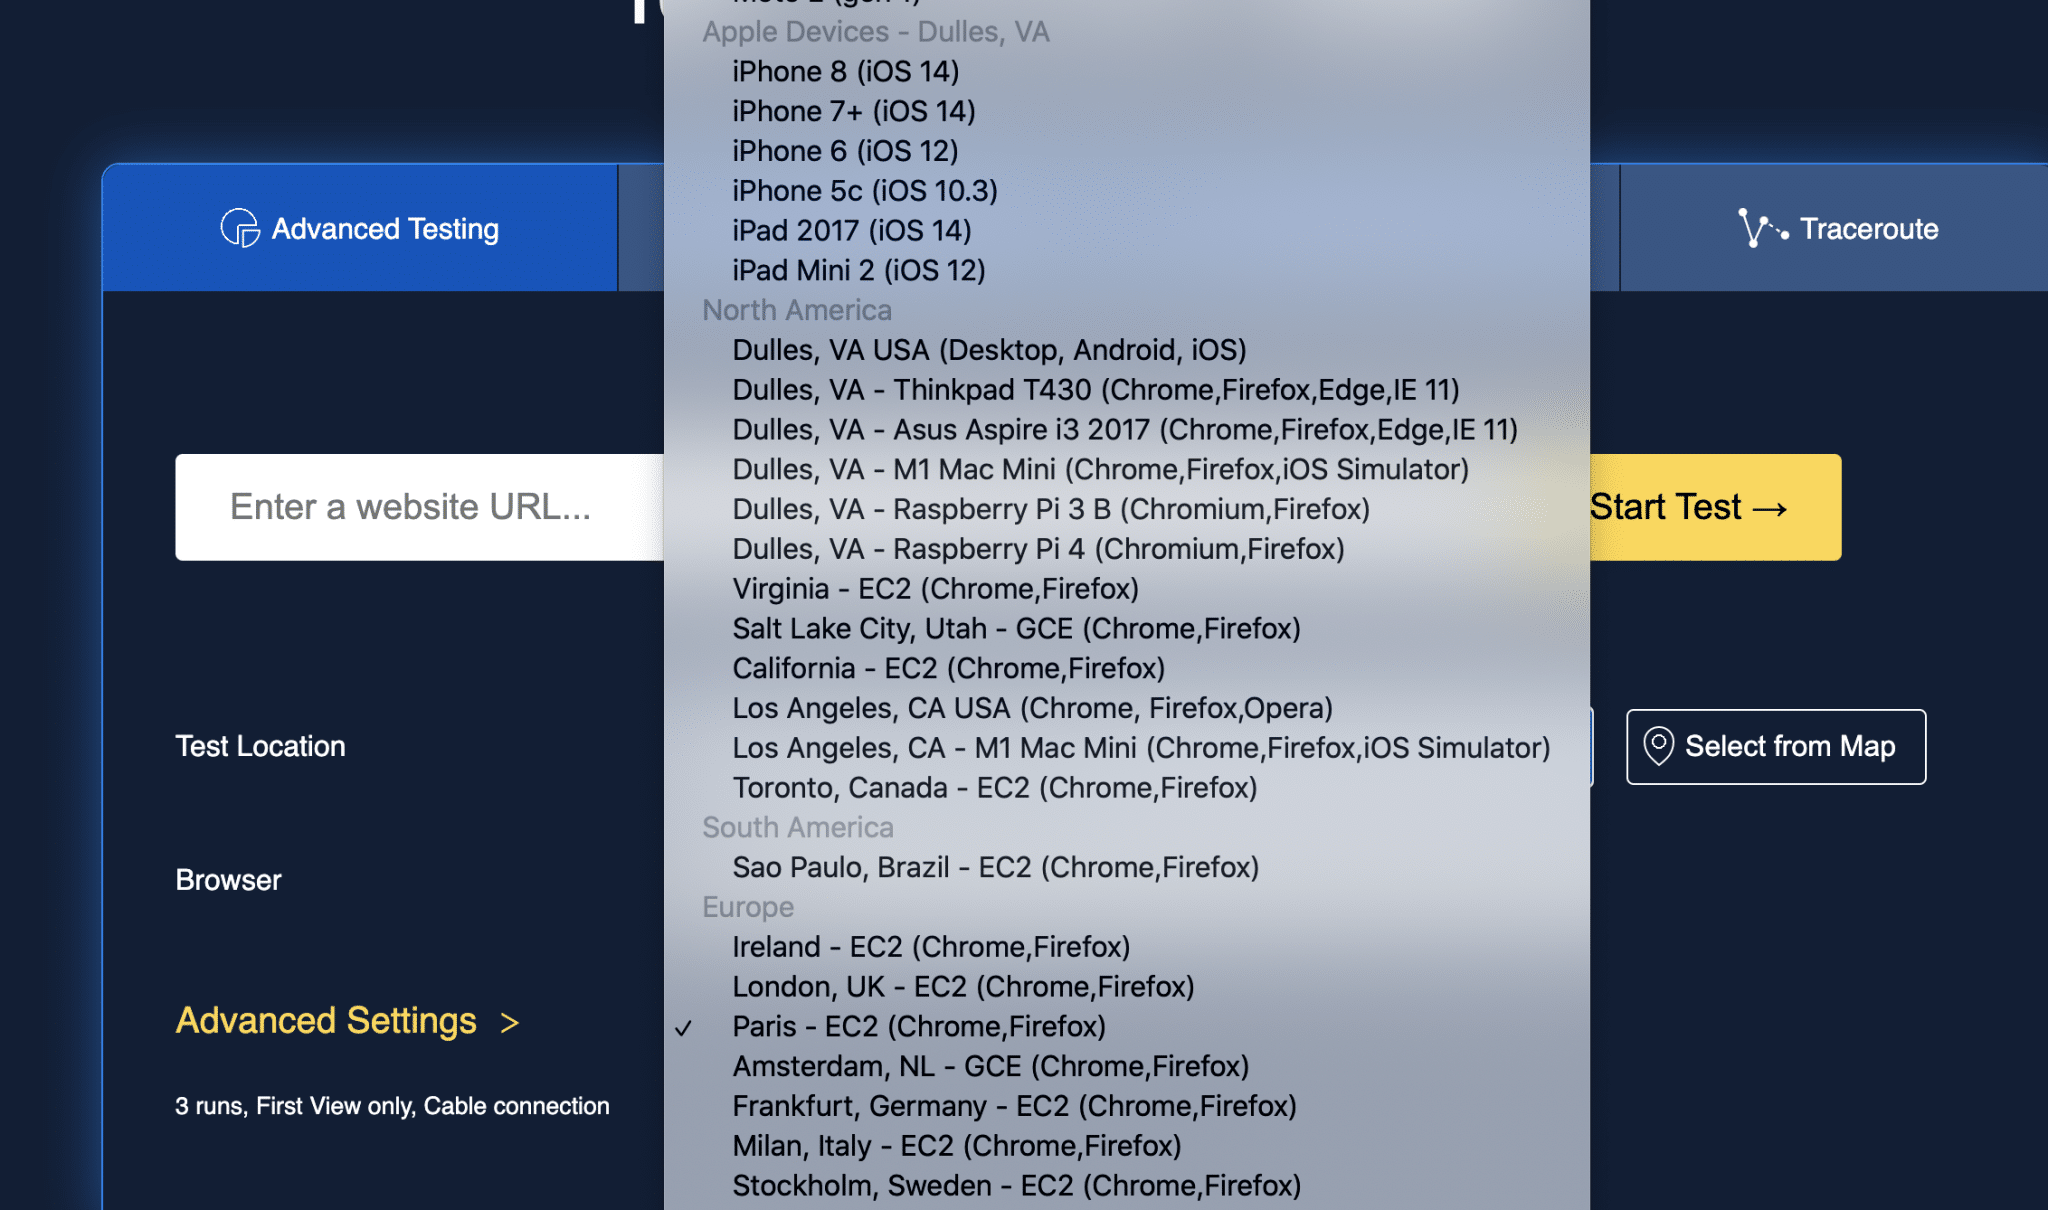
- Where does the tool test from geographically? For example, GTmetrix and Pingdom test from 7 key global regions whereas WebpageTest can test from 50 different locations around the world:
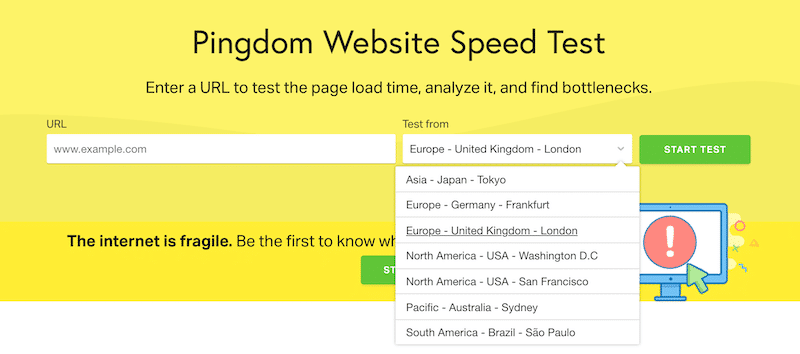
PSI on the other hand doesn’t let you choose where it tests from. You want to look into these locations and aim to test from as close as possible to your target audience. Here’s another example with Pingdom:
- How is the performance score measured? As mentioned above, most of these tools will have their own proprietary way of grading your site’s performance and it’s worth spending some time to understand the methodology of whatever you’re going to use so that you have more context as to what you’re trying to accomplish. Don’t fall into the trap of comparing them directly. Google, for example, uses Lighthouse technology to measure their Google Core Web Vitals, and it uses field data based on real users.
Matt Zeunert, Founder at DebugBear, says:
There are many ways to measure website performance, and our customers often aren’t sure what data to trust. We recommend Google’s Core Web Vitals data as the best starting point, as it’s collected from real visitors on your website.
Use lab tests like Lighthouse for more detailed reporting. Lab test results often won’t match real visitor experience, and vary between tools. But the important thing is that you can use them to identify optimizations and to quickly check if the changes you’re making are good for performance.
📌 Sum-up
- If you need a tool to do simple website speed tests and get an overall loading time analysis with: go for Pingdom Tools
- If you need to be more detailed in your test (dev scenario, for example) change locations and create waterfalls data, then check out WebPageTest
- If you want detailed test results, pick test location and change the connection speed, based on your requirements: go ahead with GTmetrix
- If you are looking for an actionable diagnostic that affects SEO and the user experience: choose Google’s PageSpeed Insights to optimize your Core Web Vitals
🏃♂️ In a hurry to optimize your site? We got your back! Check our summary below to make up your mind:
| PSI | Pingdom | GTmetrix | WebPageTest | |
| Development scenario/custom testing | ❌ | ❌ | ❌ | ✅ |
| Waterfall analysis | ❌ | ✅ | ✅ | ✅ |
| Browser selection | ❌ | ✅ | ✅ | ✅ |
| Core Web Vitals scores | ✅ | ❌ | ✅ | ✅ |
| Test based on my location | ❌ | ✅ | ✅ | ✅ |
| Connection throttling (changing intentionally the connection speed) | ❌ | ❌ | ✅ | ✅ |
| Test on mobile and desktop | ✅ | ✅ | ✅ | ✅ |
| Pricing | Free | Freemium from €8.33 /month | Freemium from €8.50 /month | Free |
How to Run a WordPress Website Speed Test and Measure Loading Time and Performance
Before you start with your WordPress website speed test, there are some recommended settings and testing principles that you should keep in mind in order to do it accurately and efficiently:
- Always test multiple times. There are a number of factors that can affect your test and so you don’t want one anomaly to mislead you about how things are really going. Run multiple tests to get a couple of different readings which will provide a much more accurate average to use as your final result.
- Test from different locations. We touched on it earlier, but especially if your target audience is global, test from a couple of different geographies as they do have slightly different contexts and circumstances. If your target market is concentrated in specific areas then it is worth weighting those results disproportionately, but the wider you can go the better in most cases.
- Make sure your website caching is turned on. This means that you can test how effective caching is in improving your website performance. WP Rocket is a great plugin for this exact purpose as it can immediately and proactively look after all your caching without you having to worry about any of the technical stuff.
- Check to see if your Content Delivery Network (CDN) is running. This is the equivalent of a global content repository where your content can be cached on servers all around the world, making things faster for those visiting your website from other countries and regions. This can be optimized using RocketCDN.
- Test from a mobile perspective. In today’s modern world, the majority of your traffic is going to come through mobile devices so it’s important that you test the performance with that in mind. For example, PSI has a mobile and desktop part of their test, so be sure to consider both. If your site runs well on desktop but not on mobile, you’re actually missing out on a lot.
Once you’ve got those in check, it’s time to run a speed test on your WordPress website. Let’s run through an example.
Example: Testing a WordPress Website Speed
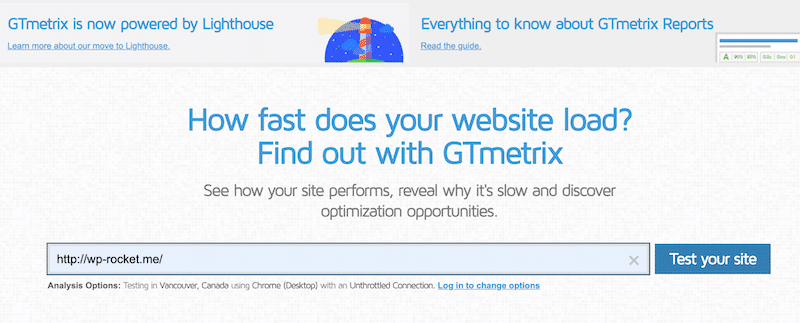
In this example, we’re going to start with Pingdom. So we head to their website and we’ll be greeted by a dialog box for us to enter our site’s URL and a drop-down menu where we can select the location from which we are going to test.

Remember to select the location closest to your target audience as we discussed earlier. Once we’ve clicked the ‘Start Test’ button it will queue our site and start running the various performance tests on the URL we entered.

After a little bit, the tool will show us the report it has generated about our site’s speed and performance.
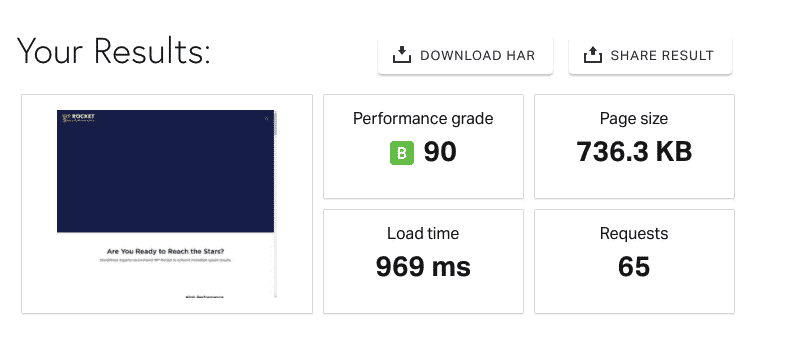
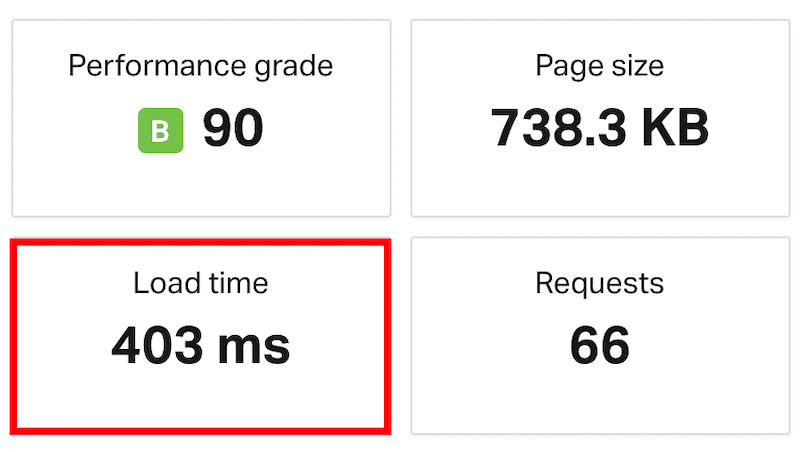
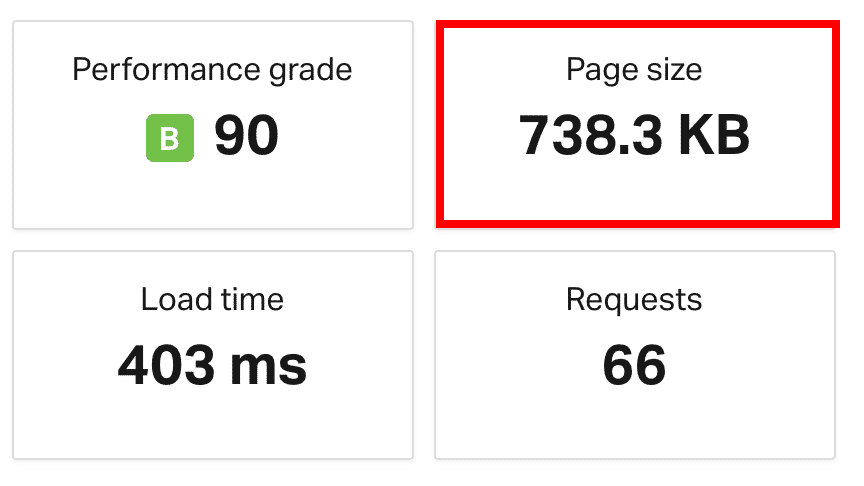
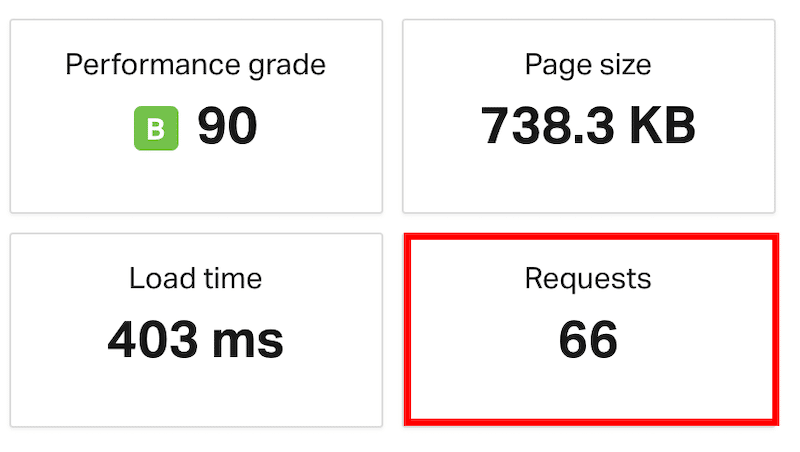
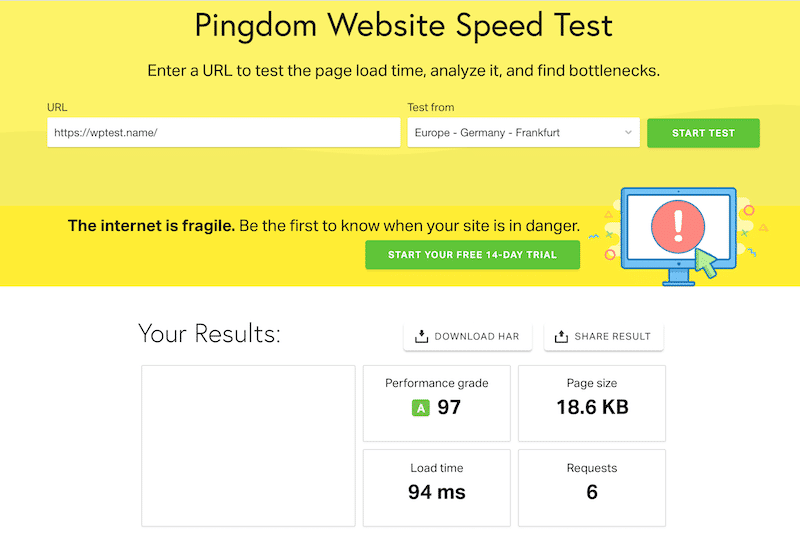
In Pingdom’s results section, they show a performance grade for the site as a whole, a load time, the page size, and the number of requests that the tool sent. This will differ according to the tool, but you’ll see similar types of breakdowns no matter what you use.
Underneath the results breakdown, you’ll see a number of recommendations for how you can optimize potential weak points and you can use that to chart how you are going to improve things.
As discussed, you’d look to run this test a couple of times and then move onto another tool perhaps.
Let’s look at PSI for some further optimization of the Core Web Vitals.
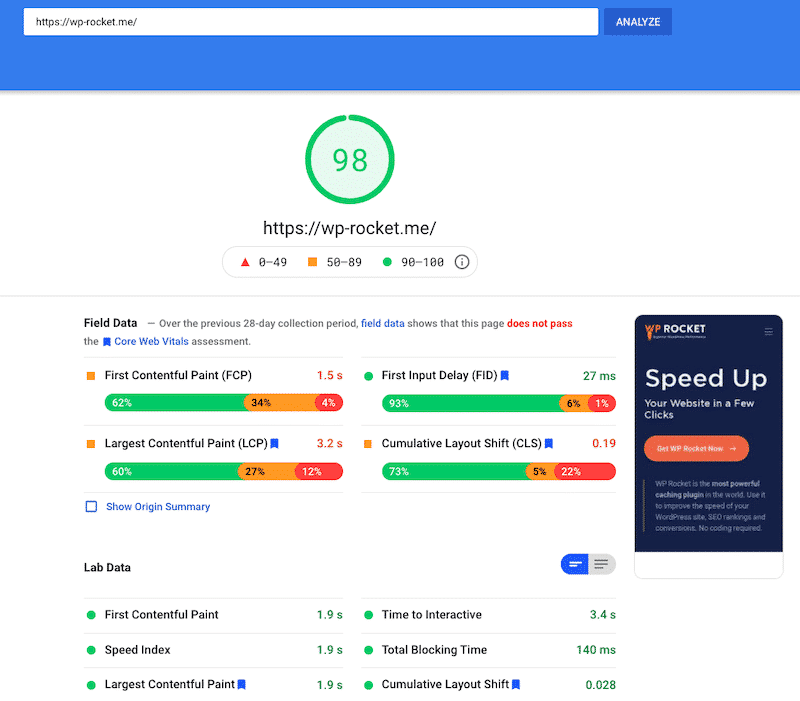
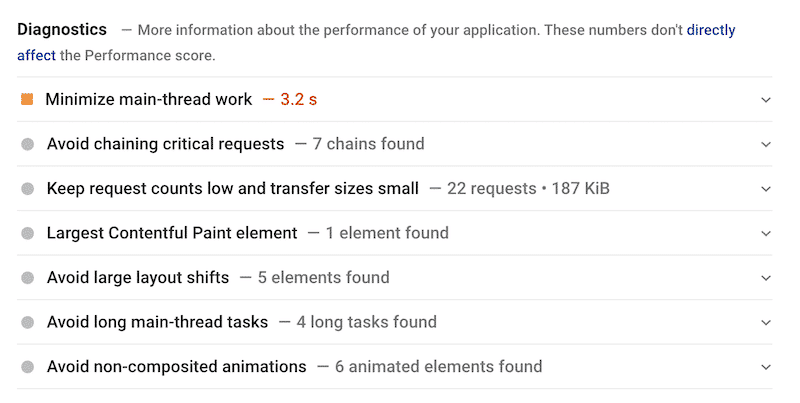
In a similar fashion, we would input the desired URL into the top dialog box and let the test run. You can see that there are some more granular metrics that are displayed by PSI and that can be useful to break down some of the performance aspects of our site that need some work:
It really is as simple as that. Running the test is easy. The interpretation of the results is pretty straightforward too:
Overall, your global grade is colored according to these ranges:
- 0 to 49 (red): Poor
- 50 to 89 (orange): Needs Improvement
- 90 to 100 (green): Good
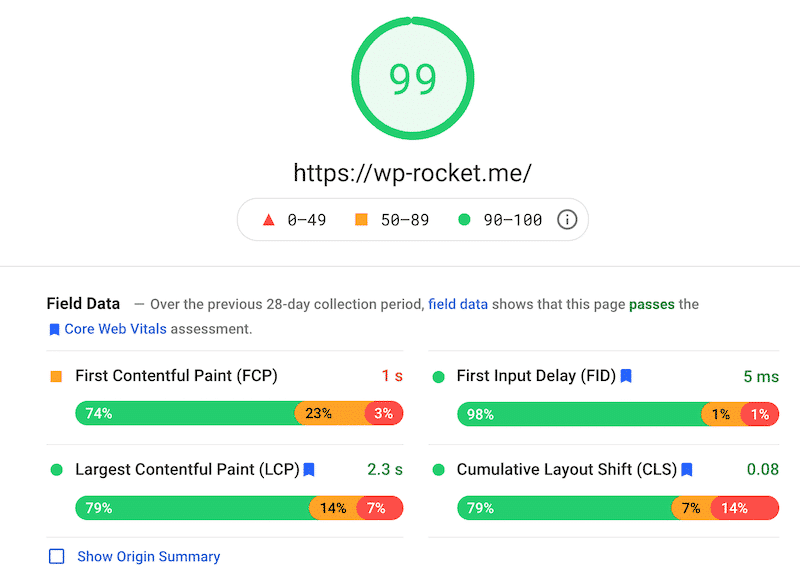
To provide a good user experience, you should strive to have a good score (90+). In any other cases, there is something major to fix.
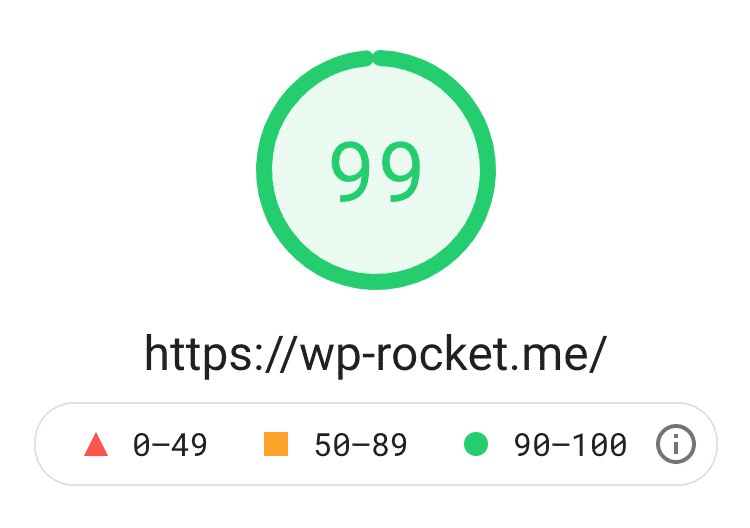
🏆 Google says that a “perfect score of 100 is extremely challenging to achieve and not expected” but WP Rocket’s website is a pretty good student that gets a score of 99!
However, the optimization and the improvements are where the hard work is. Thankfully, WP Rocket helps you optimize your Core Web Vitals.
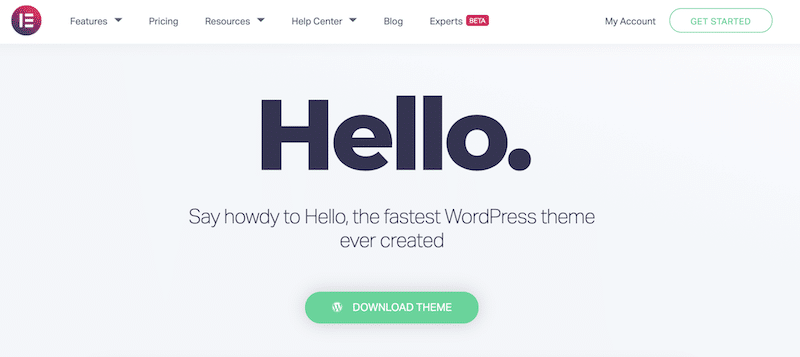
Finally, sometimes your site is not impacted so much by the content that you’ve published, but rather by the theme that you’re using. If you’re struggling with website speed it might be worth testing to see whether another theme might give you better performance.
Example: Testing the performance of the Hello Theme by Elementor
Follow those steps to check your WordPress theme performance:
- Create a blank WordPress installation
- Install and activate the theme of your choice
- Don’t add any demo content and don’t play with the settings
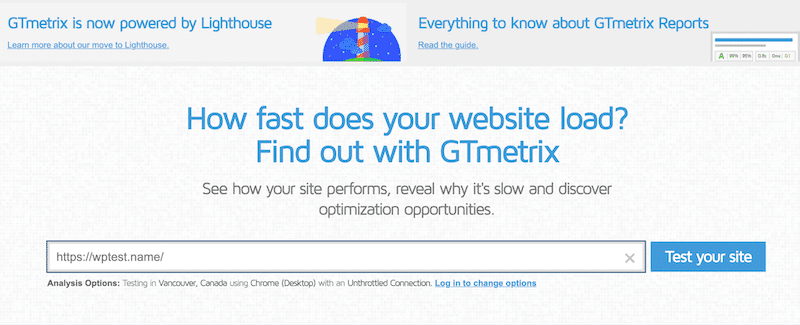
- Test the website through one of the tools. We’ll use GTMetrix, Pingdom, and PageSpeed Insights to see the results both from desktop and mobile.
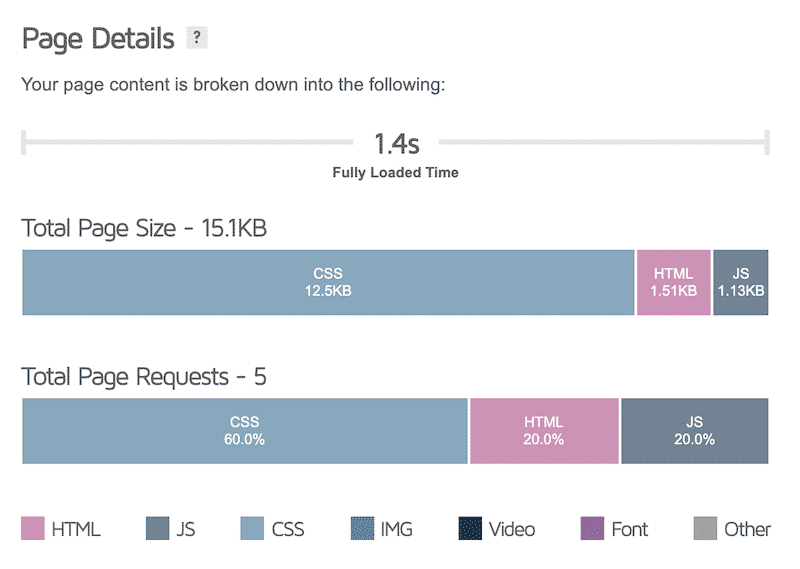
GTMetrix Website Speed Test Result (Desktop)
- GTmetrix Grade: A (Performance: 93% – Structure: 99%)
- Fully Loaded Time: 1.4s
- Total Page Size: 15.1KB
- Requests: 5
Pingdom Website Speed Test Result (Desktop)
- Performance Grade: 97 (Grade A)
- Load Time: 94 ms
- Page Size: 18,3 KB
- Requests: 6
Core Web Vitals Website Speed Test Result (Using Google PageSpeed Insights)
The device used for the analysis: Mobile
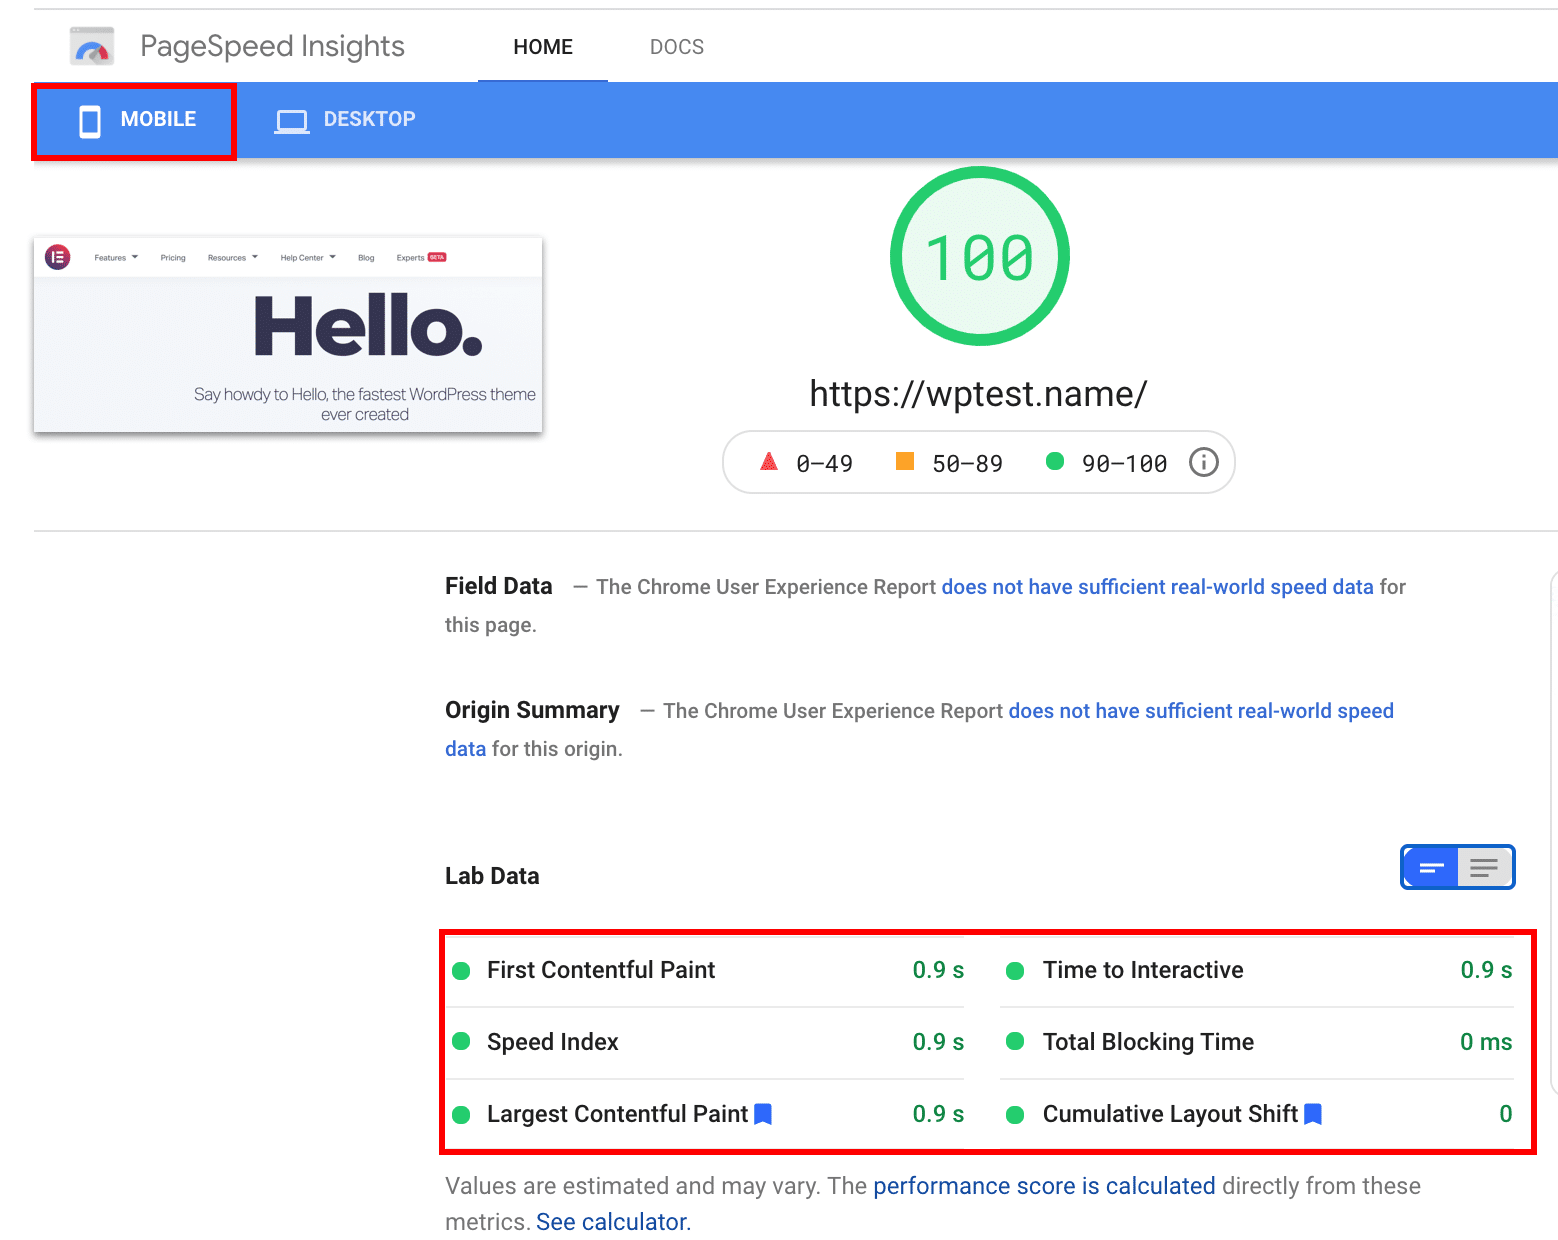
Conclusion: When it comes to page speed, performance, and lightweight files, the Hello theme is exemplary. All my Core Web Vitals and other key metrics are in the green!
Other ways you may want to explore to test the performance of your WordPress theme
- Go to the theme store where you got your theme and look at the demo sites exhibited there. You should be able to take the URL of those demo sites and run through the same process as above, before comparing that to other themes out there. As long as you keep everything else constant, you’ll get a somewhat DIY comparison between themes which can be quite useful.
- It’s also worth doing some research online and leveraging the work of others. There are a lot of speed and performance comparisons online, especially of the more popular themes, so it’s worth looking into those as well to get a sense of where your theme sits in the pile.
You’re in luck, WP Rocket already tested the 13 fastest free themes of the WordPress ecosystem.
- Check WPSpeedster: they tested almost all the themes from the WordPress repository (they’re using Google PageSpeed to run the analysis.)
What to do if you encounter an error?
If you’re running your WordPress website speed test and you encounter an error message of some sort, make sure of the following:
- You’ve included the correct URL in the box, without spelling errors.
- Write “https” and not “http”.
- You don’t have any firewall settings getting in the way depending on geography.
- Your site is published by your hosting service.
- The tool you’re using is operating correctly.
- Your site settings are nominal.
If you’re still having trouble, then it’s worth reaching out to the customer support team of that particular tool as they will be well placed to assist you.
Practical tip: If one of the tools shows some errors coming from your website (e.g some downtime) then we suggest you monitor your website. With Pingdom for example you are instantly alerted before your customers even notice.
How to Analyse WordPress Speed and Performance Results
On a high level, here’s how you should think about your speed and performance results:
- Performance Grading: Every tool will collate a range of factors and come up with a grading score (often out of 100) that aims to summarize the key factors. The higher the score, the better. This is then broken down into more granular statistics as mentioned below.
- Load Time: This is sometimes referred to as the First Contentful Paint (FCP) and here you’re looking for it to be as small as possible. The faster the load time, the better.
- Largest Contentful Paint (LCP): This is similar to the load time and you want it to be as low as possible.
- Interaction to Next Paint (INP): It’s a great indicator of a page’s overall responsiveness to user interactions.
- Time to Interactive (TTI): It’s the amount of time it takes for the page to become fully interactive. And what makes a page fully interactive? When the page responds to user interactions (like a click on a button) within 50 milliseconds. In other words, this measures the time between the FCP and the TTI and ideally you want to minimize it as much as possible.
Each tool will give you very clear visual cues about each factor, often using red, orange, and green to grade performance. You can use these for basic triage, identifying the ones that are most dire, and prioritizing the fixes accordingly.
How to Fix Speed and Performance Issues
You’ll need to look carefully through your test results to identify the ones that are affecting you. However, there are some that are more common than others, so let’s look through some of them at a high level to give you a sense as to what can be done.
Here are the actionable steps that you can take to speed up your WordPress site after getting a not-so-good result :
- Compress your images so they aren’t as large in size.
- Lazy load your images.
- Implement a caching solution.
- Use a Content Delivery Network (CDN).
- Try using a different theme that performs better.
- Optimize your databases.
- Optimize your render-blocking CSS and JavaScript.
- Reduce JavaScript execution time.
- Choose a good hosting provider.
- And much more…
All of this work on speed and performance goes hand in hand with SEO, so if you want to appear in the first few Google results, where all of the clicks go, you should always optimize your site using a tool like WP Rocket.
WP Rocket is a powerful performance plugin that can deliver significant improvements on your site without you having to do any coding whatsoever. Essentially, the tool proactively builds your website cache after just a few clicks and tweaks as necessary to improve the most relevant performance metrics.
In addition, WP Rocket also optimizes for all the Google Web Vitals.
This can only serve to drive traffic to your site and improve conversions overall:
| Performance Issue | Testing Tools | WP Rocket Features |
| Images are too slow. | PSI is best to identify the largest content to load. | WP Rocket and Imagify compress the images without the need for any coding. |
| Sub-optimal caching. | PSI, GTmetrix, WebPageTest, Pingdom | WP Rocket Cache Preloading. |
| CSS and JavaScript files are too large. | PSI (tells you which files) Pingdom, GTmetrix WebPageTest | WP Rocket can combine CSS and JavaScript files to make them faster and lighter. |
| Lack of a Content Delivery Network (CDN) | GTmetrix, Pingdom, WebPageTest | WP Rocket can integrate an external CDN in seconds, or alternatively you can use the native RockedCDN built right into the platform. |
| No GZIP compression | GTmetrix, or Pingdom | WP Rocket adds GZIP compression rules to your .htaccess file automatically |
Wrapping Up
So, there you have it! Performance scores vary because different tools use different methodologies and configurations. You can use two of them for example and compare the results against each other.
Google PSI helps to optimize the Core Web Vitals which measure the user experience and impact your ranking on Google. So even if there is no equal comparison in the tools and in their way of scoring, I’d still advise running the test on PSI so your website is ready for the changes coming in Google’s algorithm.
For many of these optimizations, WP Rocket remains your best weapon, as it caches your site automatically and go way further to optimize your website performance. It’s also the easiest way to level up your WordPress site without having to know any of the technical jargon.
Make it fast. Make it efficient. And you’re off to the races!