Table of Contents
Last update on
GTmetrix is one of the most popular website speed and performance testing tools. It scans your website to test its performance and provides you with specific recommendations for issues (if any).
Until recently, GTmetrix used the outdated PageSpeed and YSlow libraries to score your website and suggest best practices for web performance. While these libraries are great at measuring how well you’ve built and optimized your webpage for speed, it doesn’t measure the webpage’s actual performance and load speed for real users.
To fix this drawback, GTmetrix updated its algorithm to use Google’s latest Lighthouse metrics, which uses field data given by Chrome User Experience Report (CrUX).
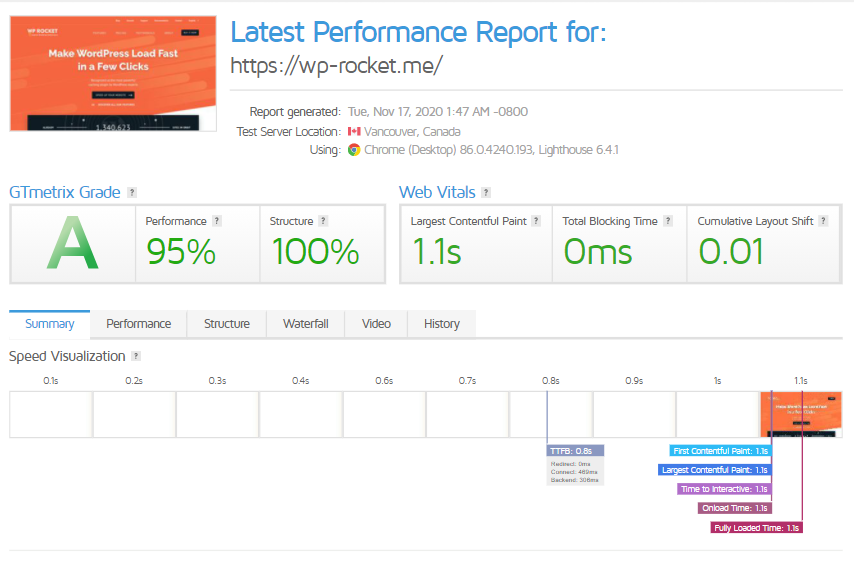
The new GTmetrix release has been announced on November 16, 2020. The update introduces a new GTmetrix Grade, alongside new Performance and Structure scores.
In this article, you’ll learn the key features of Lighthouse metrics and how GTmetrix has integrated them into its new reports.
Sounds exciting? Let’s begin!
What is GTmetrix?
GTmetrix is a free website speed and performance testing tool. It’s built by Carbon60, a managed cloud hosting company based in Canada. GTmetrix analyzes webpages using various web performance standards and gives you various recommendations on how you can optimize their code.
You can learn more about GTmetrix and how it tests webpages in WP Rocket’s in-depth GTmetrix guide.
What is Lighthouse?
Lighthouse is Google’s open-source tool for enhancing the quality of web pages. Unlike Google’s older PageSpeed Insights tool, Lighthouse analyzes a webpage in multiple ways. You can use it to test any URL for not just performance but also accessibility, SEO, adherence to best web practices, progressive web apps, and more. Keep in mind that web accessibility and SEO are closely connected.

Lighthouse focuses on user experience as a benchmark to define its metrics. All its metrics focus on evaluating how users are experiencing the webpage, and not merely measuring how fast the page loads. Here, the user’s perception of webpage performance is more important than raw stats that can give a skewed view.
Google calls these metrics Core Web Vitals. The new GTmetrix Report also features these Core Web Vitals.
Note: Google still offers the PageSpeed Insights performance testing tool, but it has now shifted to using Lighthouse as its core performance analysis engine.
What are Google’s Core Web Vitals?
Web Vitals is a Google-led initiative to help site owners understand the experience they’re delivering to their visitors. It aims to cut down complex metrics and focus only on those more important, the Core Web Vitals – which are also part of a new ranking factor, the Google Page Experience Update 2021.
Core Web Vitals are metrics that all site owners should pay attention to. There are three Core Web Vitals, each focusing on a distinct aspect of user experience.
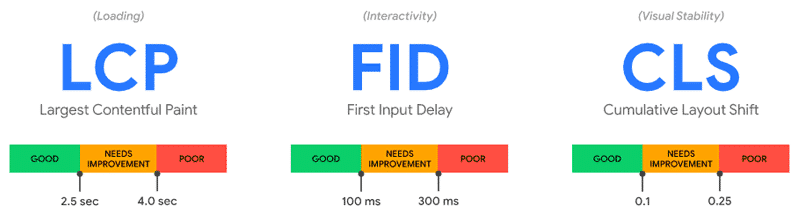
- Largest Contentful Paint (LCP): This measures your webpage’s perceived loading performance. It’s the time taken to render the page’s largest above-the-scroll element. An LCP score below 2.5 seconds is good, but it’s considered poor if it’s above 4 seconds.
- First Input Delay (FID): This measures your webpage’s interactivity experience. An FID score of fewer than 100 milliseconds is good, but if it’s above 300 milliseconds, it’s deemed poor.
- Cumulative Layout Shift (CLS): This measures your webpage’s visual stability. A CLS score of less than 0.1 represents pleasant user experience, but 0.25 and above is poor.
The metrics that define Core Web Vitals also reflect user experience better. Google stated that the Core Web Vitals score will play a significant role in their page ranking algorithm from May 2021. Hence, they are essential for your WordPress site’s SEO.
GTmetrix Legacy Reports vs New Reports
GTmetrix’s Legacy Reports may look similar to the new GTmetrix Reports, but that’s where the similarities end. These two reports highly differ from each other, both in terms of focus and testing methods.
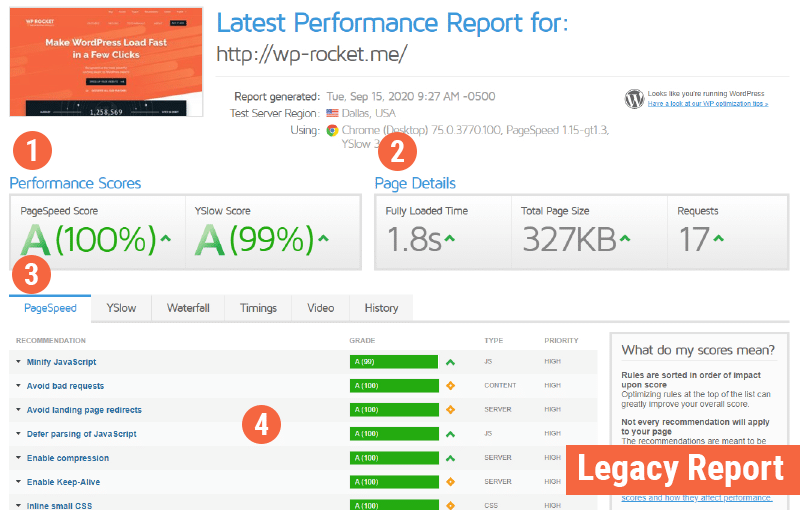
Let’s compare them on a one-to-one basis and chart out their differences. I’ll mark the important areas with numbers to make it easy for you to follow.
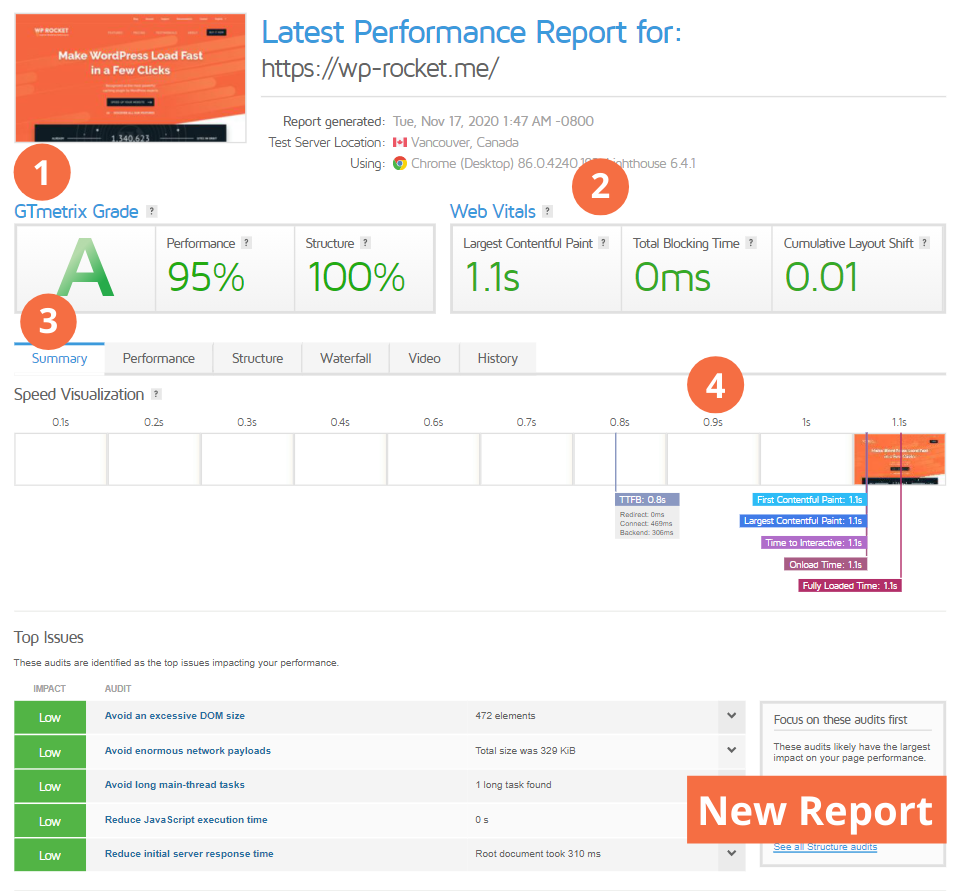
Here’s a detailed explanation of the differences between both the reports.
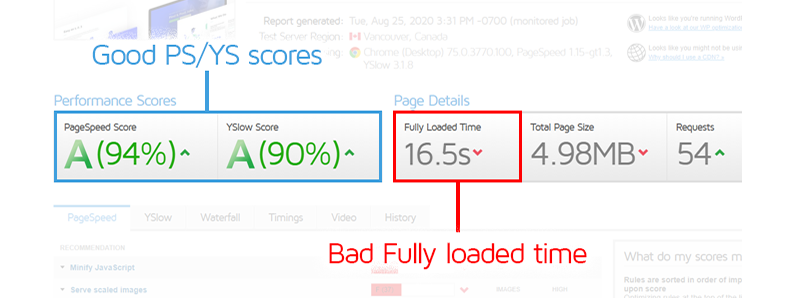
- The Legacy Report ranks individual Performance Scores with 2 letter grades based on the PageSpeed and YSlow libraries. Here, the focus is only on the Structure of the webpage.
The New GTmetrix Report gives a GTmetrix Grade with a single letter grade reflecting the overall website performance. Here you can see 2 percentage scores based on both the Performance and Structure of the webpage. The Performance score is comparable to Lighthouse’s Performance Score, whereas the Structure score is GTmetrix’s assessment of how well the webpage adheres to best practices. - The Legacy Report shows you Page Details with raw stats such as Fully Loaded Time, Total Page Size, and the Number of Requests. These stats don’t give you an idea of what the average visitor on your site experiences.
The New GTmetrix Report shows you Core Web Vitals metrics: Largest Contentful Paint, Total Blocking Time, and Cumulative Layout Shift. These metrics are a fairer representation of the user experience you offer to your visitors.
Please note that Lighthouse cannot measure First Input Delay (FID), as there is no user input. That’s why the tool takes into account the Total Blocking Time (TBT) metric as a proxy. As long as TBT gets better, FID should do the same in the field. - The New GTmetrix Report replaces the PageSpeed, YSlow, and Timings tabs from the Legacy Report with Summary, Performance, and Structure tabs. I’ll discuss all the new tabs later.
- On the primary results page, the Legacy Report shows you recommendations based on the outdated PageSpeed library, but the New GTmetrix Report provides a Speed Visualization overview. This overview gives users more context on the metrics related to their visitors’ experience once they land on the page.
As you can see, apart from sharing a few similarities like the Waterfall chart, some similar Audits and recommendations, and certain timings, they’re both distinctive.
Here are a few screenshots about the 3 new tabs.
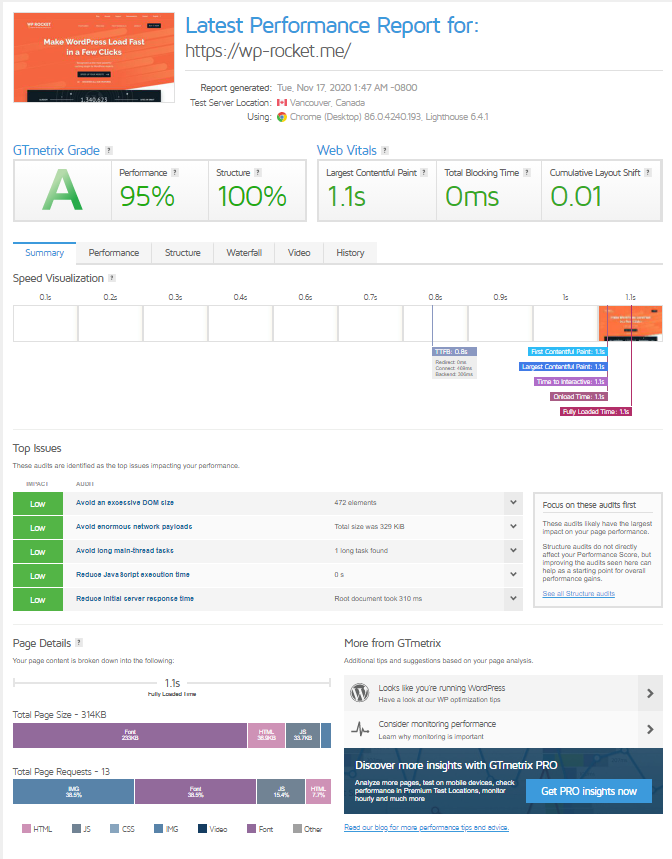
The Summary tab displays a comprehensive overview of Performance, Structure, and load behavior metrics. Thanks to this information, you can get a first picture of the main performance improvements that your website needs.
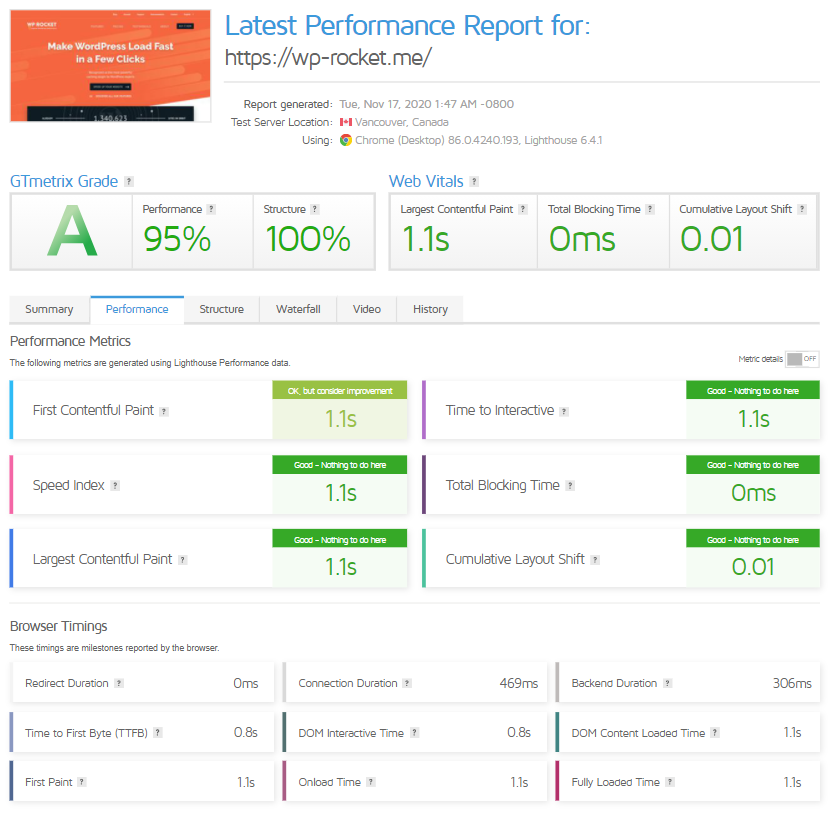
The Performance tab has two sections: Performance Metrics and Browser Timings.
The Browser Timings tab is the same one from the Legacy GTmetrix Reports.
Let’s focus on the Performance Metrics section, which displays the metrics generated using Lighthouse Performance data. These six metrics, each with its own weighting, make up the final Performance score included in the GTmetrix Grade.
The Performance score is the one that influences the GTmetrix Grade the most (70%), so it’s essential to deep dive into the specifics.
This score shows how well your page performs from a user perspective. It takes into account user-centric metrics that calculate how fast the page loads (Loading Performance), how soon users can interact with the page (Interactivity), and how visually stable the page is (Visual Stability).
Let’s take a look in detail at each metric’s weight to see how the Performance score is made up.
Loading performance metrics account for 55% of the total score and include First Contentful Paint (15%), Speed Index (15%), and Largest Contentful Paint (25%).
Interactivity’s metrics are 40% of the total score and include Time to Interactive (15%) and Total Blocking Time (25%).
Lastly, Visual Stability counts for 5% of the total score and contains Cumulative Layout Shift (5%).
You need to know that these metrics can influence each other and cause changes in the overall performance score.
Loading Performance and Speed Index
Loading performance metrics are the most relevant ones for the Performance score.
First Contentful Paint and Largest Contentful Paint focus on when the first and the main content load. You can learn more about these metrics and how to improve them in our dedicated article.
Loading performance also includes Speed Index.
Speed Index measures how quickly your page is visually complete above-the-fold.
It analyzes the page’s load behavior by taking several visual frames during the page load until all content is visible. Then, it gives the average time at which the content is displayed. Time is expressed in milliseconds and depends on the browser viewport’s size.
If your Speed Index is good, your users can enjoy a fast loading page and have a fantastic user experience.
To give you an idea, a good Speed Index is of 1,311 milliseconds or less. If the score is between 1,311 and 1,711 milliseconds, you should consider some improvements. Above 1,711 milliseconds, your score is longer than recommended; above 2,300 milliseconds, it’s much longer than recommended. Either way, there’s an absolute need for improvement.
If your Speed Index isn’t good enough, the WP Rocket plugin will help you improve your website’s loading time in a few clicks.
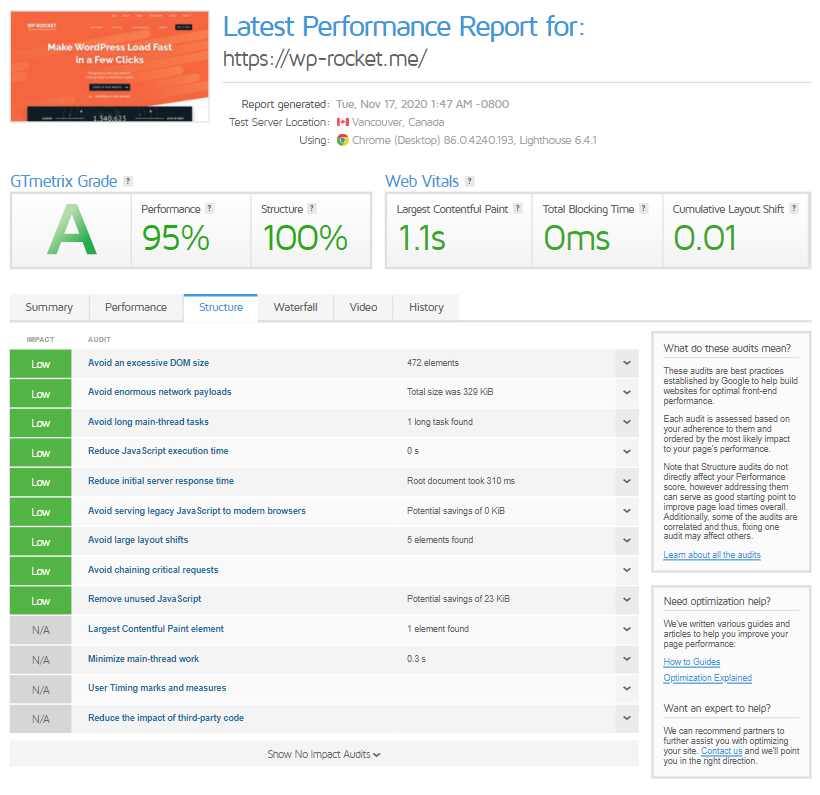
The Structure tab displays results for various Lighthouse audits related to the Structure of the page. The audits are ordered by the highest impact they can have on page performance. You can click on each audit to expand it and see what requests contributed to its impact.
Based on GTmetrix’s custom assessments and audits, the Structure score shows how well your page is built from a performance standpoint. It accounts for 30% of the GTmetrix Grade.
You can use all the information provided by GTmetrix to optimize your site for the best performance.
Fully Loaded Time vs. Largest Contentful Paint (LCP)
Historically, Fully Loaded Time was a meaningful metric to measure a site’s performance. But it doesn’t give a full picture of what the user sees on their screen.
For instance, modern sites with a heavy webpage can take advantage of client-side rendering and other web performance techniques to load the most important web page sections first and then load all the other page assets. Thus, users will perceive the page to load faster, resulting in a better user experience.
Because of issues such as this, the W3 Web Performance Working Group and Google found a more accurate way to measure website performance. The answer is the Largest Contentful Paint (LCP) metric.
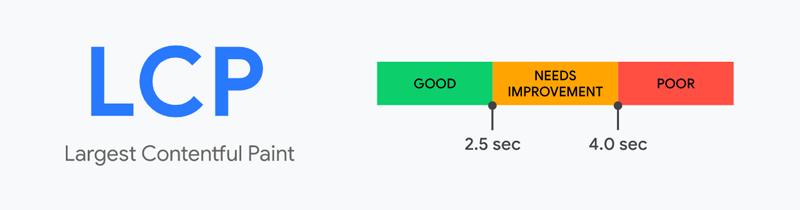
The LCP metric measures the time taken to render the webpage’s largest image or text block visible within the browser’s viewport.
As per Google, the LCP should occur within the first 2.5 seconds of page load to provide a good user experience. Anything over 4 seconds is a poor user experience, resulting in increased bounce rates and an SEO penalty.
For this reason, the new GTmetrix Report has replaced the Fully Loaded Time metric with LCP.
New Test Regions and PRO Plans
Along with updating its reports with Lighthouse metrics, GTmetrix also added 15 new test locations worldwide. Though, these new locations will only be available to GTmetrix PRO users. In this regard, GTmetrix also introduced new PRO plans. You can read about them in their blog announcement.
New GTmetrix Report vs web.dev/PageSpeed Insights
While the new GTmetrix is powered by Lighthouse metrics at its core, just like other speed and performance testing tools such as web.dev and PageSpeed Insights, there’s more to it than just that.
However, the way GTmetrix implements Lighthouse and its testing methodologies differ from what Google does. Hence, they’ll have varying differences in their results, especially when you test your site on GTmetrix with custom Analysis Options, devices, and locations.
Wrapping Up
Speed and performance are crucial aspects of offering a pleasant user experience to your site’s visitors. It makes sure that your visitors spend their limited attention consuming your site’s content and not waste it waiting for the page to load. If your site fails on this front, your hard earned visitors will bounce.
As mentioned above, Google has announced that they’ll start using the Core Web Vitals metrics as a ranking factor in May 2021. Whether you’re a developer, marketer, or site owner, prioritize your site optimization for these performance metrics.
Realizing the changing landscape of web performance optimization, GTmetrix updated its algorithm to make it easier for you to test and optimize your sites. You can make that even easier by getting WP Rocket on your side!
Do you have questions about website performance optimization, Lighthouse metrics, or the new GTmetrix report? Please leave a comment below!