Table of Contents
Last update on
This is a guest post. Opinions and recommendations are the author’s own.
We at Savvii love fast loading websites as much as you and the people behind WP Rocket. If your site is not as fast as you want it to be it’s time to improve. Before you can improve you need to measure the current load time. In this article I will show you how to spot bottlenecks and errors easily in your WordPress site with Chrome Dev Tools in a couple of minutes.
How to open dev-tools
First of all, navigate in Chrome to the page you want to test. Press Command+Option+I (Mac) or Control+Shift+I (Windows and Linux). You will see the dev tools panel open. Click on the ‘network’ tab, this is where the magic happens.
Emulate your users
When testing a website, it is important to replicate the connection and device your users use. Dev tools has some nice options for that. You can choose your connection by clicking on ‘online’, now you can switch to a 2G mobile connection for example. By clicking on the device icon you can switch between most common devices, with desktop being the default option. Bonus tip: click on the camera icon to see a filmstrip. This will visualize how fast your content is visible for your users. Remember: it is more important that a user is able to read and scan a website as fast as possible than it is to interact with a page.
To cache or not to cache
It is useful to toggle the ‘Disable cache’ box. This will give us the load time of the page without any browser caching, and therefore giving us better insights on where to improve. Caching is not always possible for all pages.
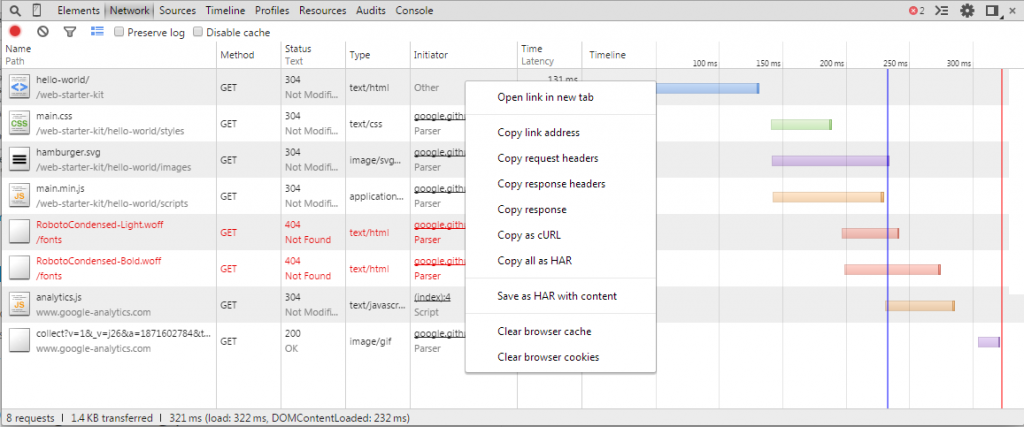
It is always possible to right click in the Dev tools pane to clear browser cookies and browser cache.
Which metric to focus on?
Before we do our first test it is important to explain the most important metric Dev tools will show you: load. The time for ‘load’ indicates when the page is ready and available on your screen, including all the other assets that the page needs to load such as images, CSS and scripts.
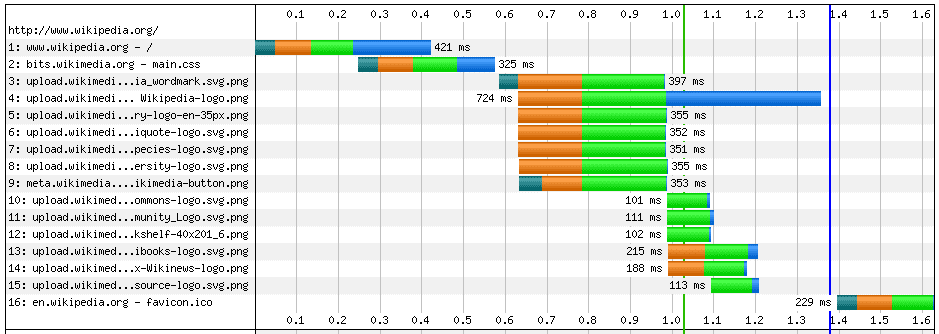
Waterfall
You are now on the page you want to test and the Network tab is opened in Dev Tool. Do a reload (instructions are visible in the dev tools pane). Chrome will generate a waterfall chart for you. You will see the results rolling in with different assets being timed and visualized in a waterfall chart. Now we know exactly how this page is loaded by the browser.
Finding the culprits
First, let’s see what time we have for ‘load’. Note this number and let’s see if we can improve this. By checking and fixing the items below we should be able to shave some time off the current load time.
Render blocking scripts
Before a browser is able to tell what is needed to display on the page, it will need to parse all the scripts the page loads. So, if you put a javascript file in the header of a page the browser has to read all the code in this file before it decides what to render on the page. These scripts delay the moment when a user sees something of your website on his/her screen. To reduce bounce rate it is very important to show something on the screen as early as possible.
You can find render blocking scripts by looking at the blue line indicating the ‘DOMContentLoaded’. Scripts that are loaded before this line are probably render blocking. You can investigate them by clicking on that script and checking the Preview tab. Try to make these scripts asynchronous, move them near the closing body tag (WPRocket can do this for you) or get rid of them completely. Google has written an excellent article on Render Blocking vs Asynchronous JavaScript.
Suspicious status codes
All assets that are downloaded from a server come with a status code. These status codes tell a lot. A status code of 200 means ‘OK’. You want all your assets to have a status code of 200.
You can find suspicious status codes by sorting the assets in your network tab based on the column Status. Skip the 200’s and focus on the other ones.
Status codes that you want to fix are mostly:
- 4xx – client errors, mainly 404 (file not found)
- 3xx – redirects, mainly 301 (permanent) and 302 (temporary)redirects
- 5xx (server errors)
Please check httpstatuses for the complete list.
Large requests
It will come as no surprise that large requests are bad. They are slow and use up a lot of bandwidth (especially for users with bandwidth limited mobile phone subscriptions). Sort on the column `Size` to find the largest assets.
Most of the times these large assets will be images or video files. Make sure the image dimensions fit the dimensions of how you use them within your site and save them with an amount of compression that makes them still OK to look at. A service like Imagify will compress these images even further while still looking good.
Slow requests
Large requests are often slow, but a slow requests does not mean it is always large. Hence it is a good idea to also sort on the column `Time`. Slow requests are often external scripts for tracking or specific functionality. You can see in the column Initiator what asset requested this asset to be downloaded. Also use the Preview tab to check the contents of the asset if you are unsure on what it is. External scripts are very hard to optimize. If they slow your site down too much consider another supplier.
How to examine assets more deeply
We already mentioned some things you can do by using the Preview tab. It is well worth your time to explore the other tabs as well: headers, response, cookies and timing.
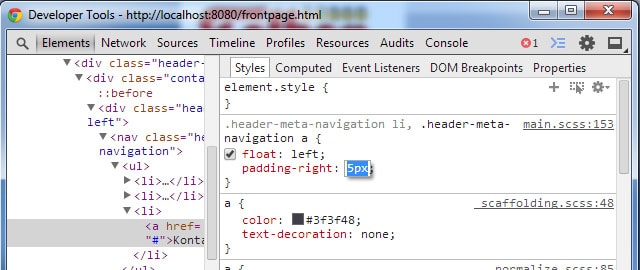
Headers
It is useful to check the headers for statements regarding caching. There are various ways to optimize caching strategies. Google has worked out a nice flowchart. Caching policies can be set by many different entities including both the server and the website itself.
We at Savvii use Varnish caching to speed up your site. If you want to verify if Varnish is working correctly on a page, these header information can be a life saver. By adding extra information in the headers you can easily see if the page is served from Varnish or not.
Response
The Preview tab will show you the visual representation of an asset (like HTML or an image) whenever possible. The Response tab will show you the code of the asset (not available for images).
Cookies
This is especially useful to check for PHPSESSID cookies. If such a cookie is present a session is used. That session could be totally needed, for example if a user has an item in his/her shopping basket. If you don’t see a reason to use a session than make sure that no session is started. Sessions make caching a lot harder.
Timing
Since we are talking about load time optimization the timing tab is important. In this tab you see timings for the different phases required to download an asset. The most important ones to analyze are:
Queuing
Assets can be queued because HTTP 1.0/1.1 can only handle six connections of the same domain at one point. If you have lots of small assets this can slow down your site. Either look to reduce the number of assets (such as using sprites), use domain sharding (with a CDN for example) or best: use a host, like Savvii, that utilizes the HTTP/2 protocol. HTTP/2 can stream any number of assets simultaneously.
Waiting (TTFB)
TTFB is an abbreviation for Time To First Byte. You should check this time for the HTML document of the page you requested. This timing measures the time it takes for the server to get the first byte back to the browser from the moment the request was sent. This includes the bootstrapping of WordPress, performing PHP functions, running database queries, parsing the HTML and sending it back to the user. You should measure TTFB twice, first check the TTFB with caching disabled and also with caching enabled (see paragraph ‘Emulate your users’). A good hosting company will utilize server-side caching to speed up your WordPress website.
All in all, I hope I have described some quick and easy ways to analyze your load time from within your browser. After this you can use WP Rocket and a good managed WordPress host like Savvii to further boost performance.
Please comment with extra Dev tool tips or questions.