
Table of Contents
Last update on
Every second counts online, and your web page speed directly affects SEO performance, traffic, and conversions. The easiest way to get a clear picture of your site’s performance is to test it on Google PageSpeed Insights (Google PSI).
It’s a free web performance analysis tool that provides an overall score (out of 100) and actionable tips to boost your performance. And the icing on the cake is that you get the results in a few seconds!
Common Myth: “I need to score 100/100 on PSI to have a fast website.”
That’s a common misconception. While high scores are nice, what matters the most is passing the Core Web Vitals (CWV) assessment on Google PSI.
But why?
Core Web Vitals is a set of three metrics created by Google to measure real user experience on a page. These metrics have become part of Google’s core ranking system, directly affecting your visibility on search engines.
This guide will help you find the right balance between applying web performance best practices and maintaining the features and design that matter to your visitors.
| 📦 TL;DR – The best of our Google PSI beginner guide Google PageSpeed Insights (PSI) is one of the best free tools for web performance testing and measuring Core Web Vitals, helping you understand how your site performs in terms of webpage speed, user experience, and web performance metrics. The PSI report flags common issues like unoptimized CSS and JavaScript, lack of caching or compression, and excessive third-party scripts—all of which can be solved with tools like WP Rocket. If your site suffers from large images or videos, Imagify can compress and convert them into next-gen formats (like WebP or AVIF) to improve loading time. Together, these tools help you act on PSI’s web performance diagnostics without needing to touch a single line of code. Key Takeaways ✅ Focus on mobile optimization first. Desktop performance will usually follow. ✅ Myth: Scoring 100/100 on PSI is the ultimate goal. ✅ Reality: Core Web Vitals are more important, as they are part of the ranking algorithm. ✅ Keep a critical mindset. Don’t remove useful features or design elements just because they are flagged by PSI, optimize them. ✅ Performance testing is not a one-time task. Monitor your site over time. ✅ Use WP Rocket for issues related to unoptimized code, lack of caching, and compression. ✅ Use Imagify to fix image-related issues flagged by PSI through smart compression and next-gen formats. ✅ For more testing conditions and advanced KPIs like page speed and page weight, try GTmetrix or WebPageTest. |
What is Google PageSpeed Insights?
PageSpeed Insights (PSI) is a free tool created by Google that analyzes a web page’s performance and provides concrete suggestions for improvement. It delivers a performance score along with detailed feedback based on Lighthouse metrics. Lighthouse is an open-source tool (also developed by Google) designed to improve the quality and user experience of web pages.
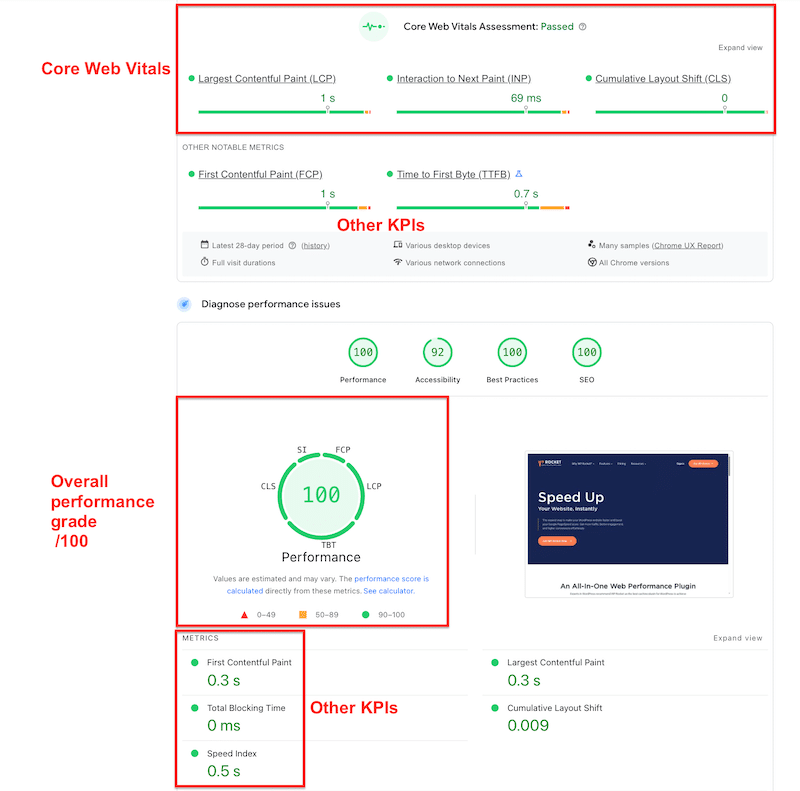
Here’s an example of the global score and a few important metrics you can find on Google PSI:
| 💡Hint: The global performance score and the PSI report can also be accessible from the Chrome User Experience Report from Chrome developer tools > Performance. |
Key Lighthouse Metrics Used in Google PageSpeed Insights
Google PSI uses Lighthouse to calculate performance scores. These scores are based mainly on Core Web Vitals and other important metrics that help evaluate user experience and loading behavior.
For each KPI, here are the score colors to follow:
- 0 to 49 (red): Poor
- 50 to 89 (orange): Needs improvement
- 90 to 100 (green): Good
And here are the metrics.
- Largest Contentful Paint (LCP) tells you how fast the main content loads.
🔍 Example: When a blog post’s hero image and title appear clearly on the screen.
- Interaction to Next Paint (INP) indicates how quickly your site reacts when someone clicks or taps.
🔍 Example: You tap “Add to Cart,” and the button instantly responds or there could be a small lag.
- Cumulative Layout Shift (CLS) measures how stable the page is while loading.
🔍 Example: You’re about to click a link when the layout shifts (like an ad), and you accidentally tap something else.
- First Contentful Paint (FCP) calculates the time until the first bit of content appears.
🔍 Example: A logo appears shortly after you land on the page.
- Time to First Byte (TTFB) indicates how long it takes for the server to respond.
🔍 Example: You click a link, and there’s a pause before anything starts loading.
- Total Blocking Time (TBT) analyzes how long the browser takes to respond to input.
🔍 Example: The page looks loaded but doesn’t immediately react to your scroll or click.
- Speed Index (SI) tells you how quickly everything on the page looks visually complete.
🔍 Example: The content fills in smoothly instead of loading in chunks.
| 💡Hint: Google Lighthouse metrics help identify potential performance bottlenecks your website is experiencing. |
Why the Core Web Vitals Assessment Matters More Than the Performance Score
The Core Web Vitals (CWV) are part of Google’s ranking signals, meaning they can influence your SEO and how your website ranks on Google. Any effort toward achieving a “Good” score on the CWV assessment means your site delivers a fast, stable, and responsive experience for your visitors, and search engines will reward you for that.
Core Web Vitals optimization also matters for WordPress agencies; most of them commit to delivering sites that score in the green. That’s the case, for example, with Agence KN in Lyon. Its founder, Thomas Baudry, explains:
The Core Web Vitals are at the heart of our quality approach: we test them regularly during development to ensure performance and smooth user experience. Just before going live, we activate WP Rocket to maximize results. We always share the PageSpeed Insights scores with our clients, along with a performance guarantee: a 90+ score in performance and accessibility and 100 in best practices and SEO.
Diagnostics Section: Actionable Tips to Boost Your Site’s Performance
PageSpeed Insights provides a detailed Diagnostics section listing specific actions to improve your site’s performance. It flags the issues, explains why they matter, and suggests what you should do to fix them. PSI detects when your site is built on WordPress and sometimes recommends that you use a plugin to fix some issues of the audit easily.
Here’s an example of the web performance diagnostics section with a list of things that should be done such as Reduce unused JavaScript, Eliminate render-blocking resources, and Enable text compression.
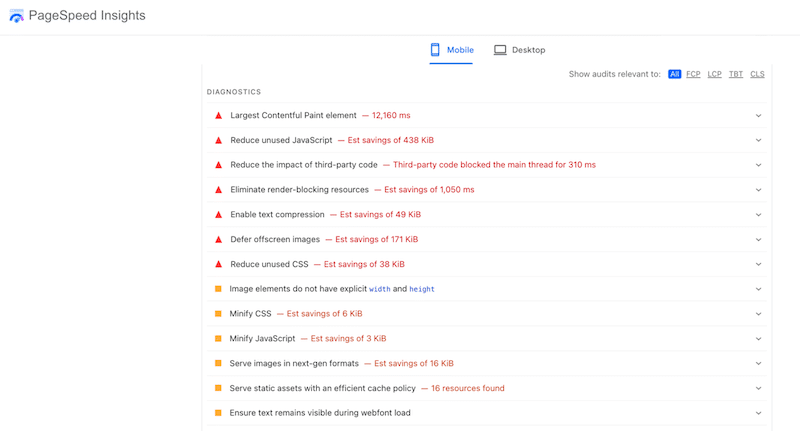
Once you solve the issue, it will be moved to the passed audit section and become green.
| 💡 Hint: Your PSI score is usually lower on mobile. It’s essential to test how fast your site is on mobile using other tools and not only on PSI because Google prioritizes mobile user experience in its ranking algorithm. |
Reading Google PSI Through a Balanced Lens
Google PageSpeed Insights helps you identify which elements are affecting performance and how to fix them, not remove them.
For example, functional features like chat widgets, sliders, and embedded videos add value to your site, but they’re often resource-heavy and can hurt performance if not properly optimized.
Imagine that PSI flags your homepage slider.
It might highlight issues such as:
- Images aren’t compressed or properly optimized
- Images aren’t served in the next-gen format (like WebP or AVIF)
- Unused CSS is increasing load time
PSI isn’t suggesting you delete the slider. Instead, it points out that the images need to be better prepared for the web: the right format, the right size, and well-compressed.
Unused CSS can be cleaned up using online tools or WordPress plugins specifically designed to remove unnecessary code. Once these web performance optimizations are done, run the test again; you’ll likely see the issue resolved or improved.
| ⚖️ Bottom line: Good performance scores benefit both users and search engines, but balance is key. Core Web Vitals are the more critical metric to focus on, not necessarily scoring 100/100 on PSI. |
Nicolas Richer, WordPress expert at wpchef.fr, says:
Getting a 70 or 80 on Google PSI is already a good sign: you know you’ve done your job pretty well! The thing is, there’s a real difference between Lab data and how users actually experience your site. Keep in mind that hitting a green score can be much harder for some sites, like a complex WooCommerce store or a page builder-heavy site, compared to a simple brochure site. So if your score is in the orange, don’t panic. Put things into context; it can still mean your site is not poorly optimized. And one last thing: mobile performance matters most, so make sure to run your test from the mobile tab. Desktop is secondary.
What Affects Your Google PSI Score
These 5 common issues often hurt your Google PSI score and have the biggest impact on your overall performance results:
1. Lack of Caching and Compression
Without proper caching and text compression, your site has to reload everything from scratch every time, increasing server load and slowing down page delivery.
🔍 Example: A site without browser caching makes every returning visitor re-download the entire CSS and JS files, even if they haven’t changed. That slows down your site, and Google PSI identifies room for improvement as a result.
2. Unoptimized Code (CSS and JS)
Bloated or unused CSS and JavaScript files can delay how quickly your main content appears.
🔍 Example: A homepage loading 600 KB of unused JavaScript delays rendering the visible content by several seconds on mobile. Google PSI will probably ask you to optimize your JS and to prioritize the essential scripts instead.
3. Large Images and Videos
Heavy media files take longer to load, especially on slower connections, affecting both speed and visual stability.
🔍 Example: A 3 MB hero image in JPG format causes the largest content to load last, failing the Largest Contentful Paint (LCP) metric. Google PSI may suggest you compress this image and convert it to a lighter format like WebP or AVIF.
4. Too Many External HTTP Requests (Including Third-Party Scripts)
Each external request adds more work to the browser, especially if files are hosted on slow or distant servers.
🔍 Example: Multiple third-party scripts like ads, chat widgets, and social feeds block rendering and drag down your Google PSI score.
5. Excessive or Poorly Managed Plugins
Too many plugins, especially outdated or inefficient ones, can bloat your code and conflict with each other, reducing performance.
🔍 Example: A WooCommerce store with more than 20 active plugins includes redundant scripts and styles that slow down every page load. Google PSI may ask you to reduce your unused code or to minimize main-thread work.
Practical Optimizations from Google PSI in Plain English
Google PageSpeed Insights often throws technical terms at you, but here’s what they really mean and how to fix them easily with two WordPress plugins: WP Rocket and Imagify. These tools work together to address most issues flagged by PSI and help you hit green scores more easily.
✅ WP Rocket is the most powerful yet easiest performance plugin for WordPress that can instantly improve your Core Web Vitals. It applies 80% of web performance best practices upon activation—like caching, compression, minification, and lazy loading. You don’t need to touch a single line of code. For advanced tweaks, you can simply enable performance features like deferred JavaScript loading or removing unused CSS in one click.
✅ Imagify is the easiest image optimization plugin for WordPress. It compresses your images without quality loss and automatically converts them into next-gen formats like WebP and AVIF. The result: smaller image files, faster loading times, and a smoother user experience, without lifting a finger.
Now that you know more about both tools, let’s see how they can help to fix and optimize some of the PSI recommendations.
1. Implement Caching
Performance warning in Google PSI: Serve static assets with an efficient cache policy.
What it means: Save versions of your website pages so they load faster for repeat visitors.
✅ WP Rocket does it automatically. Caching is enabled on both desktop and mobile out of the box when you activate the plugin.
2. Enable Compression
Performance warning in Google PSI: Enable text compression.
What it means: Shrink files like HTML, CSS, and JavaScript before sending them to the browser.
✅ WP Rocket enables GZIP compression automatically to reduce file size and loading time.
3. Code Minification
Performance warnings in Google PSI: Minify CSS and JS.
What it means: Remove unnecessary characters (like spaces or comments) in code to make it lighter.
✅ WP Rocket automatically minifies CSS and JavaScript files.
4. Eliminate Render-blocking Resources
Performance warning in Google PSI: Eliminate render-blocking resources.
What it means: Prevent certain scripts or styles from delaying the visible part of your website.
✅ WP Rocket tackles this performance issue with the “Load JS deferred”, “Delay JS execution” and “Remove unused CSS” options.
5. Implement Lazy Loading
Performance warning in Google PSI: Defer offscreen images.
What it means: Load images, videos, and iframes only when users scroll to them.
✅ WP Rocket includes a LazyLoad feature that you can enable with a single click. It improves loading speed by deferring the loading of off-screen elements, including images, CSS background images, videos, and iframes, until users scroll to them.
6. Serve Images in Next-gen Formats
Performance warning in Google PSI: Serve images in next-gen formats.
What it means: Use modern formats like WebP or AVIF instead of older, heavier ones like JPG or PNG.
✅ Imagify automatically converts your images to WebP and also gives you the option to convert them to AVIF. The plugin uses the Smart compression mode that compresses images while keeping visual quality intact.
How to Use Google PSI for Your Website
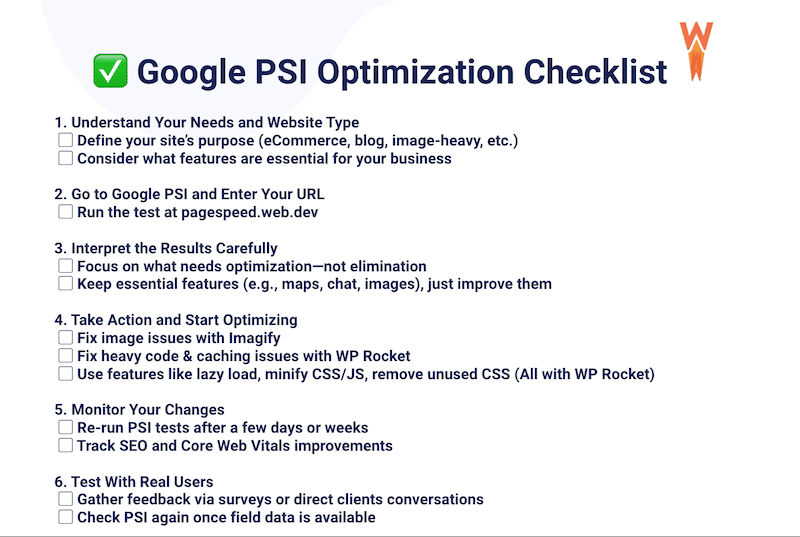
Follow these 6 steps to prepare properly, keep a critical eye, and take a step-by-step approach to improving your website’s performance:
1. Understand Your Needs and Your Website Type
Start with your site’s purpose: is it content-heavy, image-focused, eCommerce, or a simple blog? The expectations and requirements are very different. A personal blog with a few posts doesn’t have the same needs as a real estate platform with listings, map integrations, and user-generated content. Keep this context in mind before diving into performance reports.
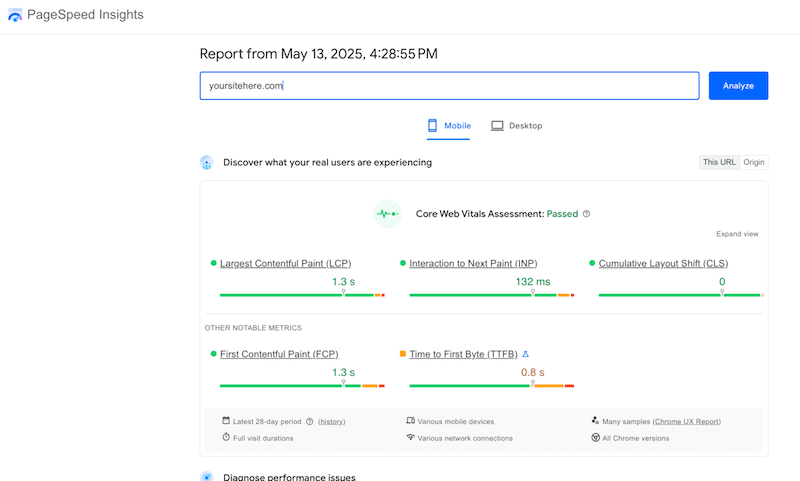
2. Go to Google PSI and Enter Your URL
Head over to PageSpeed Insights and paste your site’s URL to start the audit:
3. Interpret the Results Carefully
Use PSI to identify areas for improvement, but don’t blindly remove features essential to your business.
Example: if you run a real estate site and PSI flags your map integration as JavaScript-heavy, that doesn’t mean you should remove it. The same goes for chat plugins or high-quality images of houses for sale. Optimize those features instead of removing them.
4. Take Action and Start Optimizing
With the right tools and plugins, improving Core Web Vitals and fixing PSI issues becomes much easier.
If your report shows image issues like “Serve images in next-gen formats” or “Efficiently encode images” or “Minify JS”, “Serve static assets with an efficient cache policy”, try using Imagify and WP Rocket to fix them.
Repeat the steps for each issue flagged by PageSpeed Insights, and your Core Web Vitals will surely improve.
5. Monitor Your Changes
After a few days or weeks, run another PSI test to track improvements. You can also monitor your SEO progress—check if your rankings have improved since your Core Web Vitals went green.
6. Test With Real Users
Go beyond the numbers. Ask your visitors or customers about their experience:
- Are there too many pop-ups?
- Is the purchasing process smooth?
- Does the site feel fast?
After your site has gathered enough traffic, PSI will also start showing Field data, meaning real-world performance metrics based on actual user behavior.
Feel free to save this cheat sheet for later so you know what to do when you decide to run your first audit:
Alternative Tools to Go Beyond Google PSI Testing
While Google PageSpeed Insights is a great starting point, two other web performance tools stand out for deeper performance testing: GTmetrix and WebPageTest. Both offer more granular data and customization options that go beyond what PSI provides in terms of web performance monitoring.
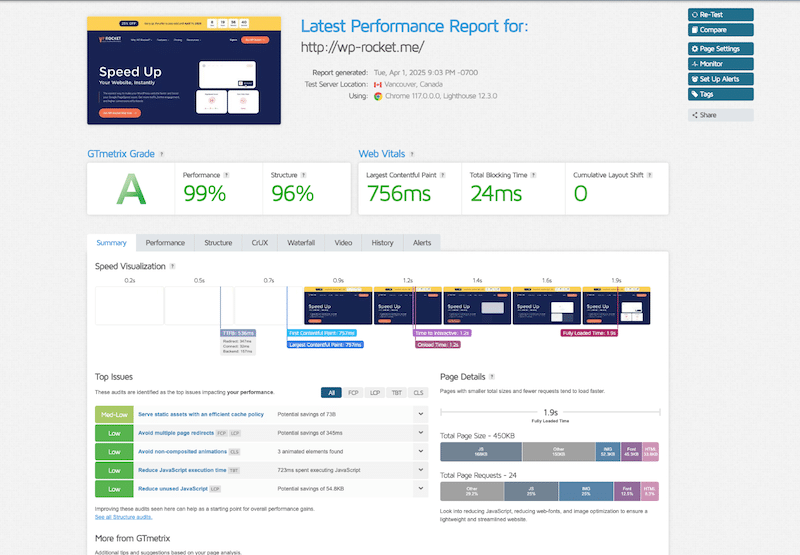
Testing Performance with GTmetrix
GTmetrix is a freemium tool also powered by Lighthouse. It is ideal for understanding how each resource impacts performance and how the site behaves under different conditions. Like Google PSI, it shows all the key web performance metrics—including Core Web Vitals—but it goes further.
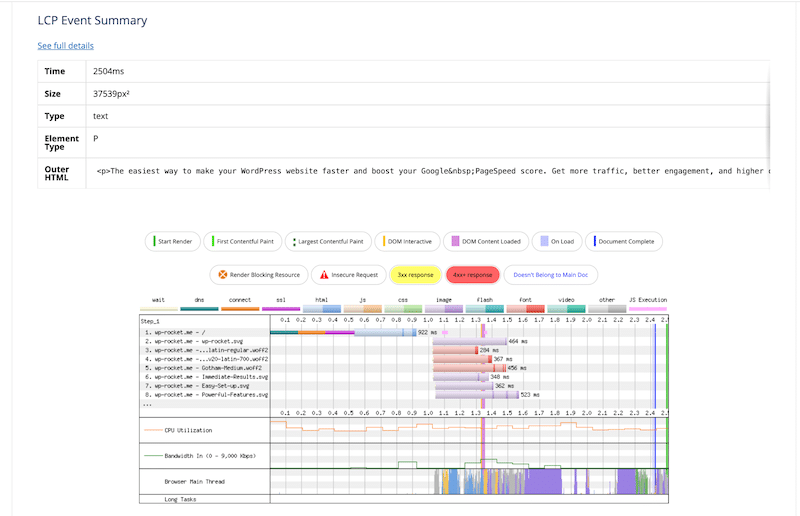
GTmetrix provides detailed insights such as fully loaded time in seconds, total page weight with a breakdown of content types (JavaScript, images, CSS, etc.), and a visual waterfall chart that lets you see exactly when and how each element loads. You can also test multiple URLs side-by-side to compare results and simulate over 40 mobile and desktop devices and several connection types (4G, LTE etc.).
Testing Performance with WebPageTest
WebPageTest is a free tool that offers advanced features for in-depth analysis and is a favorite among developers for its flexibility and detailed insights. It provides waterfall charts and a full content breakdown to help you understand exactly how your page loads.
You can visually compare multiple URLs and even export performance reports, making it ideal for deeper analysis or sharing with clients. WebPageTest supports 300 free tests per month and gives you access to over 30 global testing locations. It also allows you to test across all major browsers and connection speeds to simulate real-world conditions more accurately (similar to GTmetrix).
Google PSI Limitations
To summarize, Google PSI has three major limitations that are covered by GTmetrix and WebPageTest:
- Device specificity: You can’t select an exact device (e.g. iPhone 12) for testing.
- Location control: You can’t choose a specific location to simulate a user’s experience (e.g. Paris).
- Missing KPIs: PSI doesn’t show fully loaded time, total page weight with content breakdown, or provide a visual waterfall chart.
Here’s a summary table that compares the three tools:
| Feature | Google PSI | GTmetrix | WebPageTest |
| Pricing | Free | Freemium (free + paid plans for advanced features) | Free (300 tests/month) |
| Powered by Lighthouse | ✅ | ✅ | ❌ (uses its engine, but there is an option to get the Lighthouse results) |
| Core Web Vitals | ✅ | ✅ | ✅ |
| Performance Score & Audit | ✅ Great starting point with clear guidance | ✅ Includes audit + detailed issue list | ✅ In-depth metrics and visuals |
| Fully Loaded Time | ❌ | ✅ | ✅ |
| Total Page Weight | ❌ | ✅ With content breakdown (JS, images, etc.) | ✅ |
| Waterfall Chart | ❌ | ✅ Visual and interactive | ✅ Highly detailed |
| Compare Multiple URLs | ❌ | ✅ | ✅ |
| Custom Device Simulation | ❌ | ✅ 40+ devices including iPhones, Pixels, etc. | ✅ Choose specific devices |
| Connection Throttling | ❌ | ✅ 4G, LTE, custom | ✅ All major connections |
| Test from Specific Locations | ❌ | ✅ Available with PRO plans | ✅ 30+ global test locations |
| Exportable Web Performance Reports | ❌ | ✅ (PDF & CSV with paid plans) | ✅ |
Google PageSpeed Insights FAQs
How does Google PSI work?
Google PageSpeed Insights is a free tool that evaluates how fast and stable your web page is on both mobile and desktop. It runs a performance test using the Lighthouse technology and gives you an overall score out of 100, based on key performance metrics like loading speed and visual stability. It also provides detailed diagnostics and suggestions to help you understand what’s slowing things down and how to fix it.
How can I leverage Google PSI for mobile optimization?
The best way to use Google PSI for mobile optimization is to simply click the Mobile tab when running your PSI test. It simulates how your site performs under real-world mobile conditions, including slower connections and reduced device power. It’s the best way to see what mobile visitors are really experiencing—and where to optimize first.
How can I improve my Google PSI score?
Focus on the big-impact areas: browser caching, minimizing unused JavaScript and CSS, compressing and resizing images, and reducing third-party scripts. Tools like WP Rocket and Imagify make it easy to tackle most common issues, without touching code.
How do I download a PageSpeed Insights report?
There’s no one-click download button on the PSI interface. But if you’re a bit tech-savvy, you can use the PageSpeed Insights API to fetch your results in JSON format for reporting or integration into your tools. For everyday users, your best bet is to take a screenshot or copy the results manually.
Why are my PSI mobile and desktop scores different?
PageSpeed Insights tests mobile and desktop separately, and results often differ. Mobile scores are usually lower due to slower devices and network throttling that simulates real-world conditions. Mobile views may also load different CSS rules, impacting speed and layout.
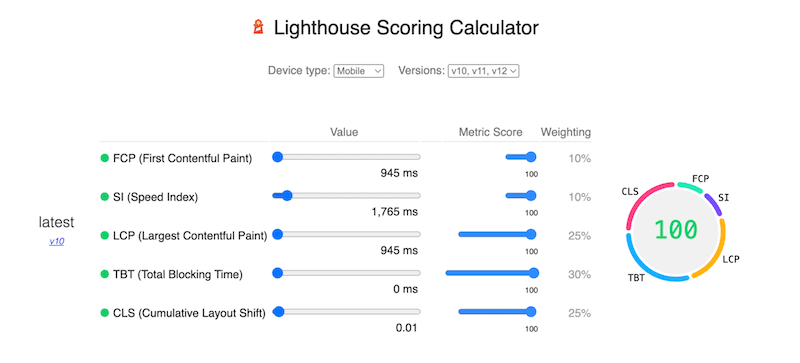
How is the Performance score measured?
PageSpeed Insights calculates your webpage performance score out of 100 based on several key Lighthouse metrics, including First Contentful Paint, Speed Index, Largest Contentful Paint, Total Blocking Time, and Cumulative Layout Shift. Each of these plays a different role in the final grade. Google’s Lighthouse Scoring Calculator indicates which KPI carries the most weight in the final grade.
What is the difference between Lab data and Field data in Google PageSpeed Insights?
Lab data is generated in a controlled test environment with fixed conditions (device, network), making it useful for debugging and spotting performance issues. Field data, on the other hand, reflects real user experiences over the past 28 days, giving a more accurate view of how your site performs in the real world.
Why does Google PSI show different scores in lab and Field data?
Because Lab data simulates loading on a preset device and connection, while Field data is based on actual visits with varied devices, locations, and networks, your PSI score may differ between the two, depending on how users actually interact with your site.
Which is more important: Lab data or Field data?
Field data is generally more valuable because it’s based on real user experience. However, Lab data is still essential for testing and fixing performance issues during development. Ideally, use both together to guide improvements.
Wrapping Up
Google PageSpeed Insights (PSI) is one of the most reliable free tools to measure your website’s performance and identify what’s affecting speed and user experience. It focuses on key web performance metrics and Core Web Vitals, which are directly tied to your SEO and rankings.
This article should have helped you better understand how PSI works, how to read its reports, and what practical steps you can take to improve your scores, without sacrificing your design or functionality.
Now it’s time to take action:
Run your audit on Google PageSpeed Insights and optimize your Core Web Vitals with WP Rocket — no risk taken thanks to the 14-day money-back guarantee!