Table of Contents
Last update on
“A fast website is a good website” is a phrase you’ve no doubt heard time and time again as you’re continually working on improving the user experience of your site, especially as users these days expect websites with lightning-fast load times.
But what exactly does “fast” mean in the context of website performance? Well, it can mean a lot of things, and that’s the problem – measuring the web performance of your site involves many metrics. So in order to fully understand your site’s performance, you need to grasp what performance metrics you should be measuring, why, and what you can learn from them in order to optimize your site for better speed.
So in this post, I’ve put together a list of the key web performance metrics you should be regularly monitoring.
1. Uptime
Whether you run a small business or non-profit, an online store, or a simple blog, if traffic can’t reach your website because it’s down, then you are effectively closed for business. And that, in a nutshell, is why uptime is a critical concern for site owners.
Uptime is the responsibility of your web host, so if you experience frequent downtime or bandwidth issues, it’s worthwhile reviewing your hosting options. While no host can guarantee 100% uptime, you should be aiming for uptime 99.99% of the time.
Services like Pingdom and Uptime Robot can monitor your site and instantly alert you when it goes down so you can act quickly to get your site back online.
2. Time to First Byte
The time it takes for the first byte of information to reach a visitor’s browser after a connection to the server has been requested is called time to first byte, or TTFB.
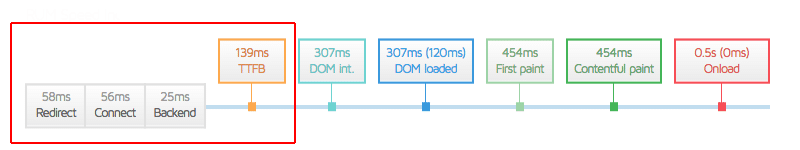
This key metric is calculated by adding up the redirect duration (the time spent sending a request to the server), the connection duration (the time spent processing and generating the response), and the backend duration (the time it takes to send the response back to the visitor’s browser).
There are some ways you can improve your site’s TTFB, including optimizing code, implementing caching, fine-tuning your web server configuration, and upgrading your server hardware. The order in which site visitors receive information is also important and can help boost your TTFB.
3. Time to First Paint
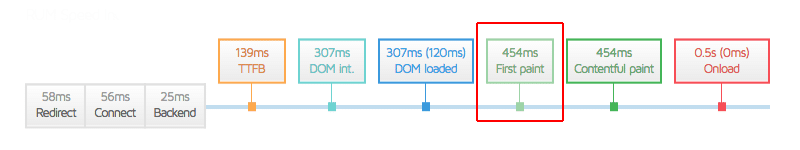
First paint (FP) time marks the point, immediately after navigation, when the browser renders pixels to the screen. Depending on the structure of the page, this could be displaying the background color or it could be most of the page being rendered.
Google describes this key metric as important to the site visitor because it answers the question: is something happening?
FP timing is significant because up until this point, the browser will have only displayed a blank page and this state change shows the visitor that the page is loading.
4. Time to First Contentful Paint
First contentful paint (FCP) time is the point when the browser rends the first bit of content from the Document Object Model (DOM), which might be text, an image, SVG, or another element.
For site visitors, this timing signifies when actual content has been loaded on the page, and not just any change.
As you can see in the example below from my speed text, the FP and FCP timings are identical as these metrics are closely aligned.
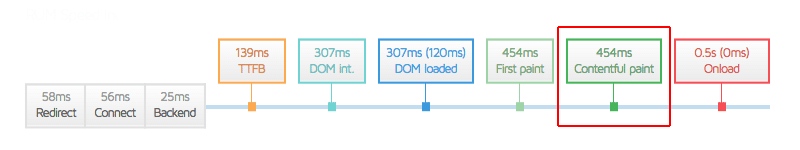
Why exactly is this metric useful for site admins? Like FP, FCP provides an indication of when site visitors receive “consumable” information (text, images, etc) and can see that a page is loading and something is happening. Find out how you can improve FCP on WordPress.
5. Largest Contentful Paint
The Largest Contentful Paint (LCP) metric tells you how long it takes for the largest element on the page to become visible in the viewport. The largest element is usually a text block or an image. This metric is pretty important since it’s one of the Core Web Vitals, and can also affect your SEO performance. Needless to say, it’s essential for you to optimize the LCP score.
6. First Input Delay & Interaction to Next Paint
The First Input Delay (FID) is a former Core Web Vitals metric replaced by Interaction to Next Paint (INP). INP measures the responsiveness of your page. FID measures the first interaction by analyzing how long it takes for the browser to respond to the first user’s interaction with a page. Since FID can be only measured with real-user data, you can also take a look at the Total Blocking Time (TBT), which measures interactivity with no user interaction. If the TBT is good, you should not worry about the FID performance as well.
7. Time to Interactive
The Time to Interactive (TTI) metric marks the point at which the page is both visually rendered and capable of reliably responding to user input. This means the visitor can scroll the page, click on links, and complete other interactions. During this loading period, some elements such as scripts might be still continuing to load.
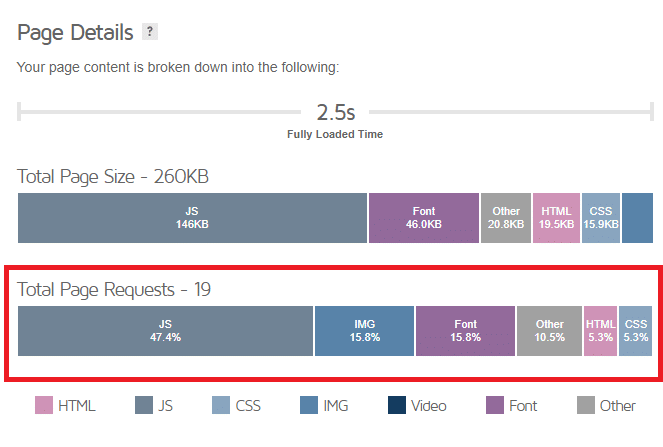
8. HTTP Requests
Every time someone visits a page on your site, their browser pings your web server (as well as third-party servers if you’re using content from social networks, advertising platforms, etc.) and requests the files that contain the content of the page, including HTML, CSS and JavaScript files, images, icons, and other files. These requests are called HTTP requests.
I wrote about HTTP requests recently for this blog, so rather than re-invent the wheel I’d encourage you to check out my post, How to Reduce HTTP Requests to Speed Up Your WordPress Site.
It’s worth noting that reducing the total number of HTTP requests your site makes can dramatically increase the speed of your site – a page that is only 100 KB but has 85 HTTP requests is probably worse off than a 200 KB page with only 15 HTTP requests. But do keep in mind that while this is true for HTTP/1, it’s not the case for sites using HTTP/2.
9. Onload Time
Onload time is when the page has finished processing and all of the resources on the page, including text, images, CSS, and JavaScript files, have finished downloading. During this time, there may be JavaScript that initiates subsequent requests.
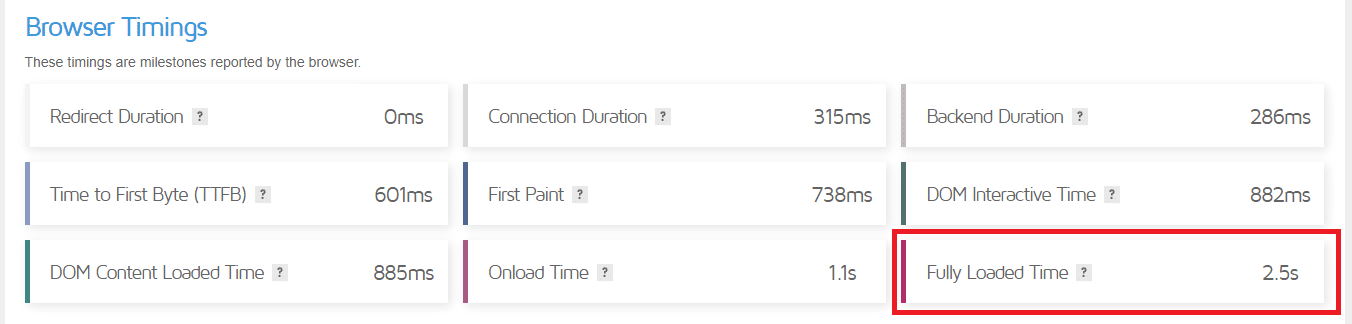
10. Fully Loaded Time
The time to fully load is measured as the time from when the visitor initially navigated to the page until 2 seconds after there’s no network activity. Like onload time, this usually includes any activity that is triggered by JavaScript after the main page loads.
11. Connection Time
Let’s back up for a minute and look at connection time. This is the time between a request and when a connection is made between the visitor’s browser and the web server.
There are a lot of different factors that can contribute to connection time, such as heavy server traffic and the visitor’s geographical location. In order to improve your site’s connection time, you might want to experiment with load testing tools like Apache JMeter, WebLOAD from RadView, and LoadComplete from SmartBear.
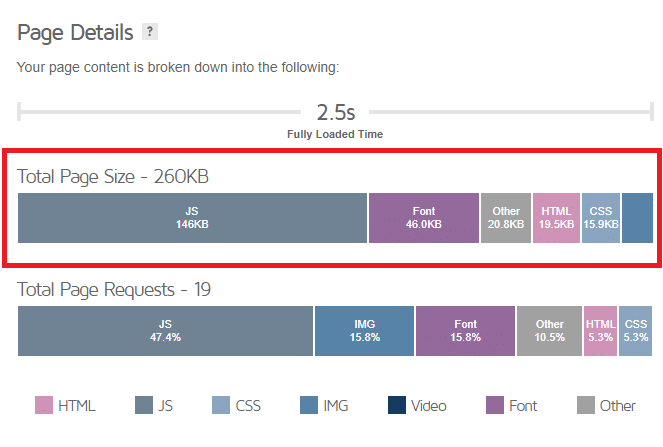
12. Total Page Size
This metric refers to the total sum of all the elements it takes to render your page, including the HTML file, CSS and JavaScript files, images, multimedia, third-party domains, everything.
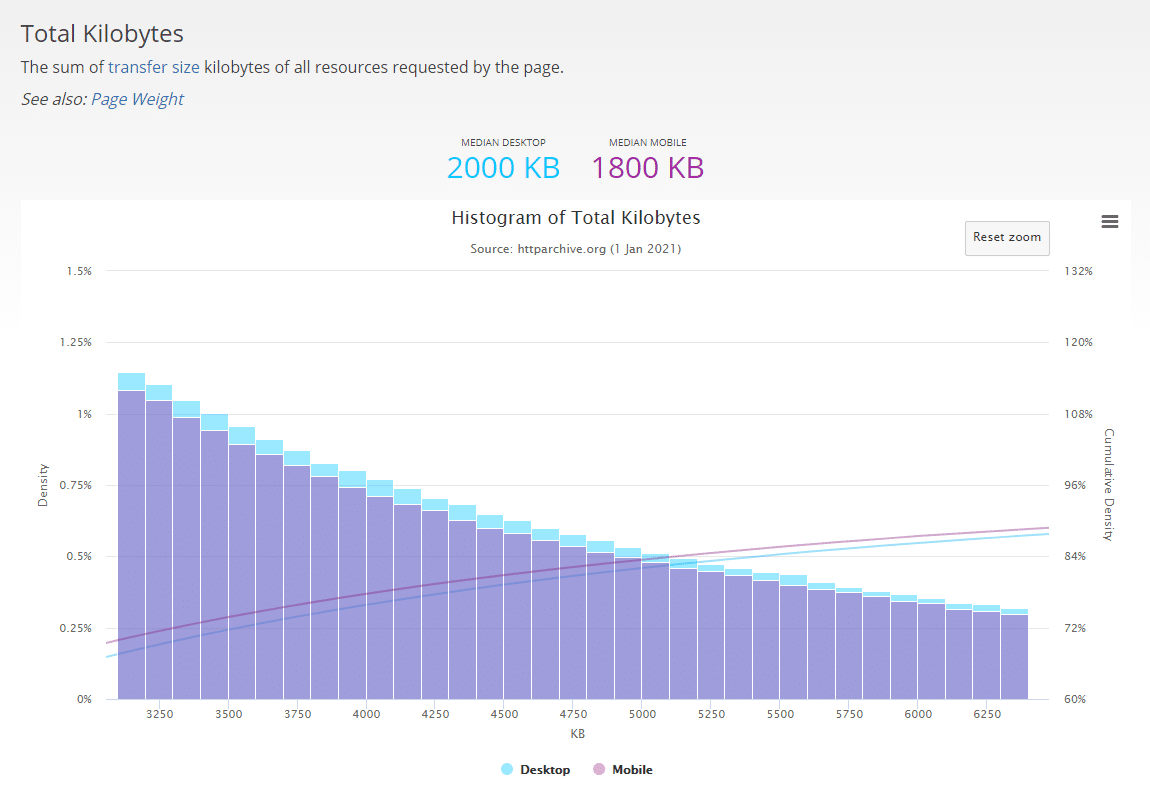
HTTP Archive has been collecting information about websites since November 2010 and offers some interesting stats around total page size going back over the years.
In 2011, web pages on average were 717 KB. In 2021, the average is 2000 KB from desktop and 1800 from mobile.
13. Third-Party Domains
While most of your site’s content is hosted on your web server, there’s probably some third-party content site uses, such as embedded video, Gravatars, and social media widgets, that is hosted on third-party domains. Because these elements are stored on other domains, you have very limited control over their functionality and the speed at which they load.
The best way to gauge what impact these elements are having on your page speed is to do a waterfall analysis to identify which assets are taking the longest time to load. You might then want to consider whether you really need certain slow-loading assets or want to remove them completely.
Conclusion
Regularly testing your WordPress site performance monitoring these metrics will provide you with the information you need to assess the performance of your website and determine what updates and tweaks you need to make in order to achieve the lightning-fast load times that site visitors now expect.
One more user-centric metric that’s worth keeping in mind is perceived performance, i.e. how long a visitor feels like it’s taking for your pages to load. I recommend you read up on this user behavior in addition to making other performance tweaks to speed up your websites.