Table of Contents
Last update on
How do you measure website performance? There’s a lot of information online about how to optimize websites, but how do you really know when you’ve done enough?
To help developers measure their optimization efforts—and to remind them to put users in the middle of the performance story—a couple of Googlers have developed the RAIL model.
RAIL is a user-centric performance model that breaks down the user’s web experience into four key actions. It encourages developers to think holistically about web performance and rather than ask “what does slow mean?” instead ask “what does the user feel when they’re interacting with the things we build?”
In this post, we’ll explore what RAIL is, the guidelines the model sets out to help you determine when you’ve “done enough,” and tools you can use to measure RAIL on your website.
What is the RAIL Model?
When a web page is loading, there’s a whole lot of technical stuff going on behind the scenes. On the backend, the site is requesting and receiving files and resources, while on the front-end the browser is loading words, images and other media.
While all this is happening, the user is waiting for the page to load so he or she can start interacting with it, which is all well and good if you’ve optimized your page speed. The problem is, developers often forget about what happens after a page has loaded.
According to Google’s Web Fundamentals Guide, users spend the majority of their time waiting for sites to respond to their inputs (i.e. clicks, taps and toggles), not waiting for sites to load. So while your site might load lightning fast, it means diddly-squat if a user then clicks a link in your navigation and it takes two seconds for the input to register.
The RAIL model takes this into account, breaking down the user’s experience with a website into four key actions: response, animation, idle, and load.
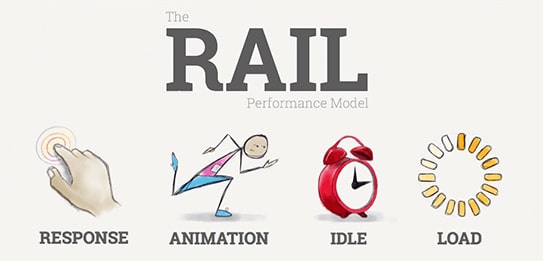 Image: Paul Irish.
Each RAIL action comes with its own performance goals, which are based on human perception thresholds, which we’ll cover shortly. The idea behind the model is that if you optimize your site based on each of these areas and provide a consistently fast web experience, then your users will be happy.
Before we dig into the specifics of RAIL and the benchmarks it sets, it’s important to first understand human perception thresholds.
Time and Perceived Performance
When you’re optimizing your site to make it faster, do you think about how a user might feel while they’re browsing your site? Probably not. Yet, this perceived notion of your site’s performance is a critical part of RAIL.
Jakob Nielsen’s work on response times has been the go-to academic research for human perceptions of web performance since it was published in 1993. In 2015, when Googlers Paul Irish and Paul Lewis proposed their RAIL model, they revised Nielsen’s original findings, adding in an extra response time (0 to 16ms) for animations.
- 0 to 16ms: People are really good at tracking motion and don’t like it when animations have variable frame rates or excessive halting. Animations are perceived as smooth so long as 60 new frames are rendered every second. That’s 16 ms per frame.
- 0 to 100ms: Users feel responses to their actions that happen in less than 100ms as immediate. Any longer and the connection between action and reaction is broken.
- 100 to 300ms: Users feel a slight perceptible delay.
- 300 to 1000ms: Within this window, users feel like “things are happening,” i.e. pages are loading and tasks are progressing.
- 1000ms or more: Beyond 1 second, users lose focus on that task they’re performing.
- 10000ms or more: Beyond 10 seconds, users are frustrated and are likely to abandon tasks if they haven’t already.
These perception thresholds are useful to keep in mind since they provide a handy guideline for how long your site should take to respond to various user interactions.
It’s important to keep in mind, however, that how users perceive performance delays often depends on network conditions and the device they are using. For example, it wouldn’t be out of the question to expect a page to load in less than 1 second on a powerful desktop machine over a fast wi-fi connection, but for mobile devices using slow 3G connections, loading in 5 seconds is more realistic. As such, mobile users are generally more patient.
For more on human perception thresholds, check out What is Perceived Performance and Why You Need to Optimize It.
The RAIL Model’s Performance Benchmarks
The great thing about RAIL for developers is that it provides a structure for thinking about web performance, but also sets benchmarks we can aim for when building and optimizing websites.
Let’s look at each of the four key areas of RAIL in more details.
Response
Response relates to how fast your site responds to a user interaction. For example, this might be a clicking, toggling form controls, or starting an animation. It’s crucial your site responds immediately before there’s any noticeable lag. Otherwise, the connection between action and reaction will be broken.
As Lewis describes, if you’ve ever clicked on something and it took so long to respond that you started wondering whether it registered your click, so you clicked a second time, but in doing so you interrupted the response to your first click… Well, this is exactly the kind of thing RAIL aims to avoid.
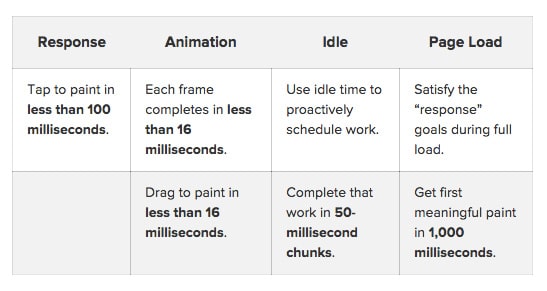
Goal: Process events in under 50ms.
Google’s guidelines: Sites should process user actions/inputs within 50ms to ensure a visible response within 100ms. For actions that take longer than 50ms to complete, always provide feedback, i.e. display a loading indicator or change the color for the active state.
Animation
Animations have become so ubiquitous in web design that users expect very smooth interactions and notice immediately when the frame rate is even slightly off.
Animations include:
- Visual animations. This includes entrance and exit animations, and loading indicators.
- Scrolling. This includes using a scroll bar, but also flinging, which is when a user starts scrolling, then lets go and the page keeps scrolling.
- Dragging. Such as passing a map or pinching to zoom.
Goal: Produce a frame in 10ms.
Google’s guidelines: To animate properly, each frame of an animation should be completed in less than 16ms in order to achieve 60 frames per second (i.e. 1 second ÷ 60 = 16.6ms). The maximum “budget” for each frame is 16ms, but browsers need about 6ms to render each frame.
Idle
Idle time refers to what is happening behind the scenes of your site after it has initially loaded. As I mentioned in a recent post about prebrowsing techniques, idle time provides an ideal opportunity for preloading, prefetching, and preconnecting resources.
Goal: Maximize idle time to increase the odds that the page can respond to a user interaction within 50ms.
Google’s guidelines: Only load the most critical elements of your page during the initial load, and use idle time for everything else. Google recommends grouping any deferred work during idle time in 50ms blocks so your site can respond within the 100 response window. If a user interacts with a page during idle time work, their interaction should take priority and interrupt the idle time work.
Load
Load refers to getting the user to the first meaningful paint quickly. This means loading pages in less than 1 second.
The faster your pages load, the less like users will bounce—and the less likely they will lose focus and perceive a task they are trying to complete as broken. It’s no surprise that, according to Google, sites that load quickly have longer average sessions, lower bounce rates, and higher ad viewability.
Goal: Deliver first meaningful paint in 1 second and achieve time to interactive in under 5 seconds.
Google’s guidelines: Optimize your page speed relative to the devices and network connections your users use to access your site. Focus on optimizing the critical rendering path for your site to unblock rendering and use idle time to your advantage. Google recommends pages should load and be interactive in 5 seconds or less on mid-range mobile devices using slow 3G connections. For subsequent loads, aim for 2 seconds or less.
Tools for Measuring RAIL
The goals set by RAIL might seem lofty, but they’re actually not all that difficult to measure and track using three freely available tools: Chrome DevTools, Lighthouse, and WebPageTest.
- Chrome DevTools: Chrome’s built-in developer tools let you peek behind the curtain, so to speak, providing an in-depth analysis on everything that happens while your page loads or runs. Google provides more specific instructions on how to use DevTools to measure RAIL metrics in this guide.
- Lighthouse: This fantastic audit tool is available in Chrome DevTools, as a Chrome extension, as a Node.js module, and within WebPageTest. Basically, you enter a URL and Lighthouse simulate a mid-range device with a slow 3G connection. It runs a series of audits and then gives you a report examining your site’s performance, whether it meets best practices, its accessibility, and SEO.
- WebPageTest: We’ve covered this speed testing tool on this blog before. When you enter a URL to test, use the advanced settings to choose a mobile device and a slow 3G connection to emulate RAIL’s load guidelines.
Conclusion
It’s easy to get caught up optimizing sites and obsessing over speed. What RAIL does is provide a framework that puts the focus on the overall user experience, giving developers reliable benchmarks for measuring and improving website performance.
To recap, here’s a handy breakdown of RAIL’s performance goals:
 I highly encourage you to test your site against RAIL’s benchmarks and discover what improvements you can make to create a more enjoyable user experience.