

Table of Contents
By Nick Schäferhoff - Last update on
PageSpeed score is a central performance metric in Google’s PageSpeed Insights tool. It tells you what kind of user experience your web pages deliver.
In this post, we’ll cover PageSpeed score in detail, how it’s calculated, how it differs from other performance metrics, why it matters for SEO, and how to use it to meaningfully improve your web pages without chasing vanity metrics.
If you are looking to fix specific issues raised by PageSpeed Insights, check out our dedicated article.
| TL;DR ✅ PageSpeed score is a central performance metric in PageSpeed Insights. It’s calculated from five metrics (FCP, LCP, TBT, CLS, and Speed Index) that cover both page loading speed and user experience. LCP, TBT, and CLS make up 80% of the score. ✅ Because PageSpeed score is based on lab data (simulated page visits), it can differ from how your page performs for real visitors. For a fuller picture, rely on Core Web Vitals and real-life field data from the Chrome User Experience (CrUX) report if available. ✅ PageSpeed score itself isn’t a Google ranking factor, but it reflects performance and user experience signals that are. Therefore, improving it still supports better SEO outcomes. ✅ Don’t chase a perfect 100/100. Aim for the green zone (90-100) and balance preserving essential features against improving your score. Prioritize mobile performance and global fixes (like caching and compression) before page-specific changes. ✅ WP Rocket helps boost your PageSpeed score without any coding. It applies 80% of performance best practices by default upon activation and offers additional one-click improvements. |
PageSpeed Score in a Nutshell: What It Is and Isn’t
Simply put, PageSpeed score is the number PageSpeed Insights (PSI) displays in its Performance report.
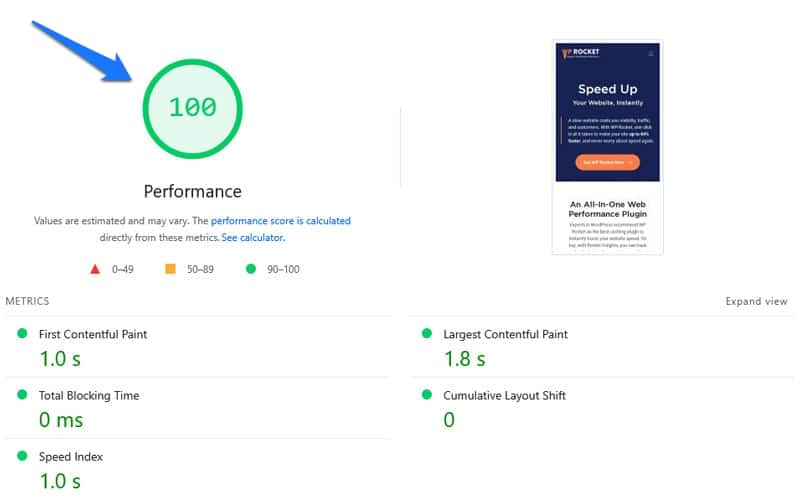
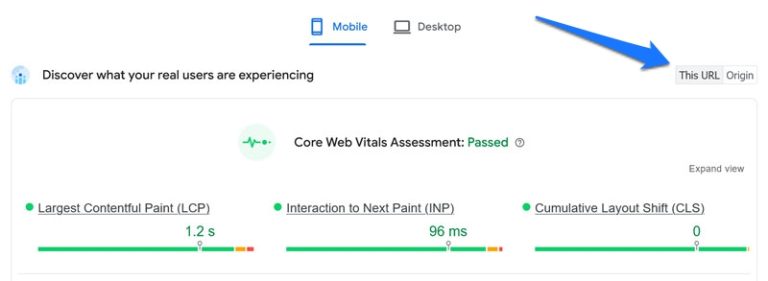
PageSpeed Insights is an open-source tool by Google you can use to analyze the user experience of web pages. It’s based on Lighthouse and it also has audits for web page accessibility, best practices, SEO, and agentic browsing capabilities. Yet, the main focus is on page loading speed and user experience and PageSpeed score reflects only those two factors. By default it also only displays audits for the single page tested, though average performance data may be available via the Origin toggle.
What’s important to know about PageSpeed score is that it uses lab data. That means, its results are based on simulated page visits from virtual devices. It does not reflect the experience of real-life users. The tool even displays the specific setup used for your report.
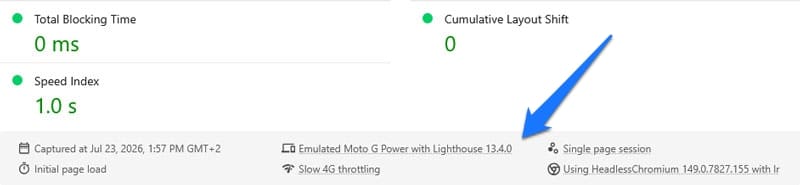
This has consequences for optimizing your web pages. For example, results can vary depending on the specs used, even in back-to-back tests. We’ll discuss more differences between lab and real-life data below.
PageSpeed Insights also creates separate reports for the desktop and mobile version of your page. You can toggle between them at the top.

That’s because mobile connections and devices are often less powerful than their desktop counterparts, leading to lower performance. Additionally, the majority of internet users surf the web via mobile devices and Google uses a mobile-first index to determine search rank. That means it evaluates your web pages based on their mobile version, even for desktop searches.
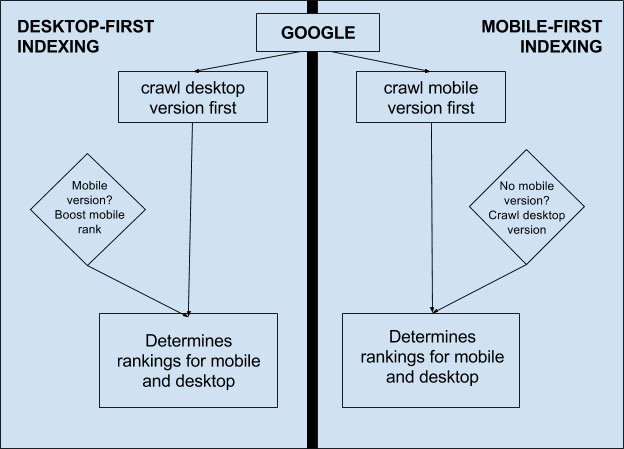
That’s why PageSpeed Insights shows the mobile report by default.
Finally, contrary to popular belief, PageSpeed score is not a ranking factor. At the same time, its information is relevant for SEO and we’ll discuss specifics below.
How PageSpeed Score Is Calculated
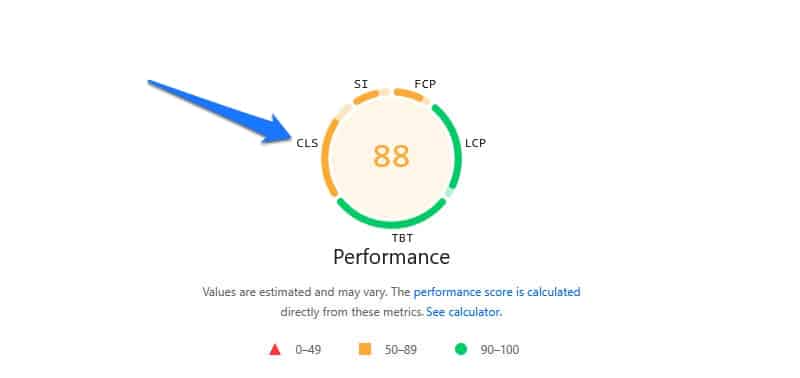
Google uses several metrics to determine PageSpeed score, namely First Contentful Paint, Largest Contentful Paint, Total Blocking Time, Cumulative Layout Shift, and Speed Index. Here’s what’s behind those terms:
- First Contentful Paint: A metric for how quickly any part of your page’s content renders on screen during a visit. It greatly affects perceived loading time.
- Largest Contentful Paint (LCP): How long it takes for the main page content (e.g. a hero image or heading) to appear.
- Total Blocking Time (TBT): Tracks the time it takes the browser to respond to input.
- Cumulative Layout Shift (CLS): Describes the visual stability of your pages, meaning how much page elements move during the loading process.
- Speed Index: Evaluates how long it takes for the page to look visually complete.
Each metric contributes to the final score to a different degree. The Lighthouse Scoring Calculator shows their exact share and how the total changes when one value improves or deteriorates.
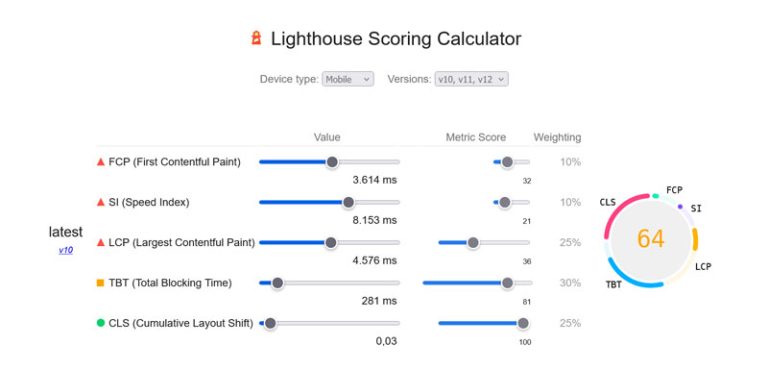
LCP, TBT, and CLS carry the most weight; they account for 80% of the overall score. Consequently, if you want to improve your PageSpeed score, that’s where you should put most of your optimization efforts.
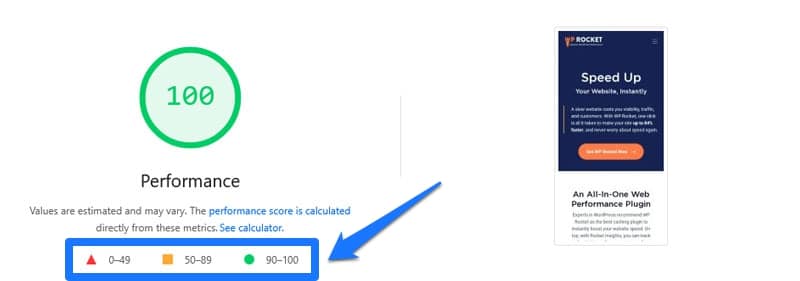
The score has three buckets: A good score (green) is 90 or above, if your score is 50 to 90, it needs improvement (orange), anything below 50 is a poor score (red).
PageSpeed Score vs Core Web Vitals vs Real-Life Page Speed: What’s the Difference?
PageSpeed score differs from actual page loading speed for two reasons: First, it uses lab data and secondly, it evaluates pages based on more than just how fast they appear in a browser. For a more complete picture, you’re better off relying on Core Web Vitals and field data.
Why PageSpeed Score Isn’t the Same as Real-Life Page Performance
The lab data PageSpeed score is based on uses simulated page visits under fixed, emulated conditions. It does not accurately reflect how your page behaves on diverse visitor devices and networks.
Additionally, PageSpeed score tracks overall user experience, including interactivity and layout stability. So, if your page has bad CLS and you improve it, its score will go up while your page may continue to load slowly.
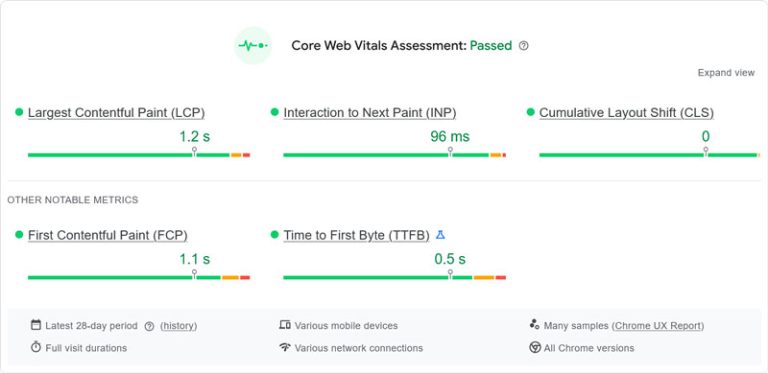
That’s why PageSpeed Insights also has the option to display field data from the Chrome User Experience (CrUX) report. It’s a dataset where Google collects real-world experience stats from visitors accessing your site using the Chrome browser. If your site receives enough traffic, this data may show up in PSI in the form of the Core Web Vitals Assessment at the top of the screen, telling you exactly what kind of performance people experience on your site.
| 💡 Use our pre-launch checklist to ensure your site is set up for loading fast from the get-go. |
Understanding Core Web Vitals and Real User Field Data
Core Web Vitals are user experience metrics Google has been using as ranking factors since 2021. That means, they directly affect where your page appears in search results.
We are already familiar with two of them: LCP and CLS. A third one is Interaction to Next Paint (INP), which indicates how quickly your site reacts to user interactions like clicks or taps. In PageSpeed score’s lab data, Total Blocking Time serves as a proxy for INP.
The Core Web Vitals Assessment shows your page’s performance for all three Core Web Vitals. It also includes scores for FCP and Time to First Byte (TTFB), which measures how long it takes the server to respond. This data more accurately reflects how your page performs for real-life visitors, which can be different from lab results.
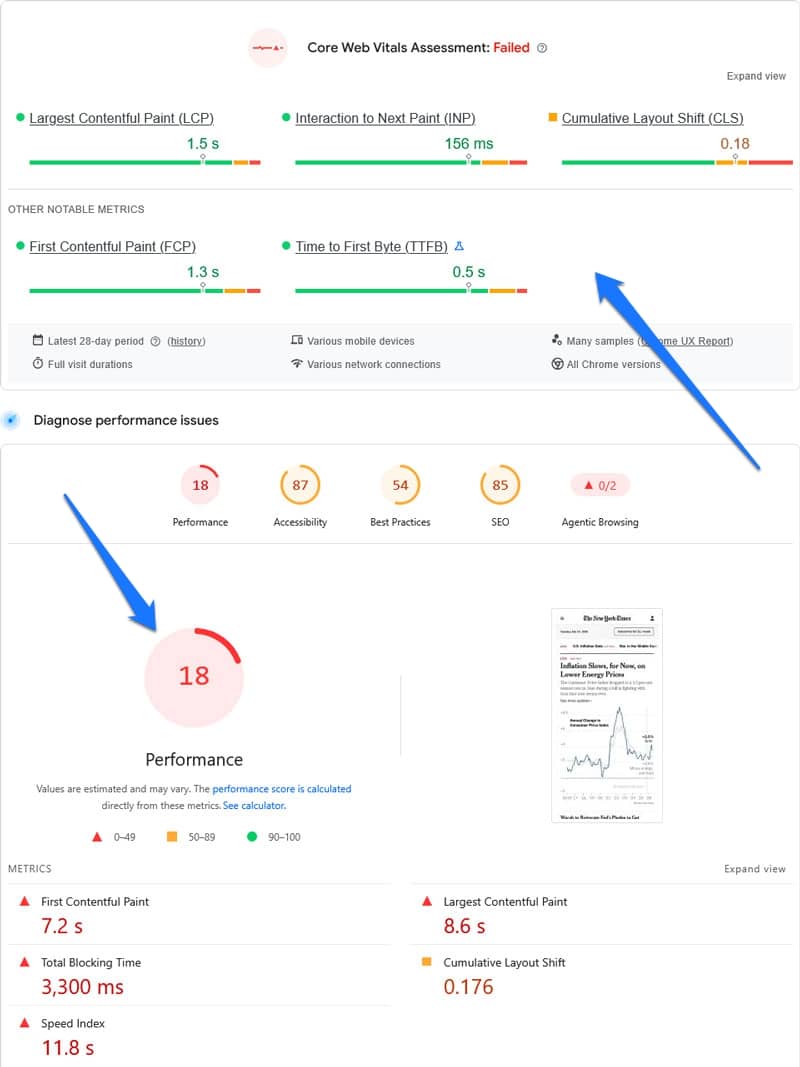
In the example below, you can see that while the New York Times website has an abysmal PageSpeed score, four out of five metrics in the Core Web Vitals Assessment are green. The lone value that isn’t (CLS), is not too far off, showing that real-life user experience is actually quite good. You wouldn’t know that looking only at PageSpeed score.
How Accurate and Reliable is PageSpeed Score?
Given the above, it’s natural to ask how trustworthy the information is that PageSpeed score delivers. And the answer is that, despite possible discrepancies, it’s a very dependable tool to improve user experience on your web pages that Google has continuously improved over the years.
For example, the last major version of Lighthouse, which forms the basis for PageSpeed Insights, came out in October 2025. It removed eight existing audits and consolidated two dozen others into more streamlined performance insights. We cover many of them on this blog, including:
Since then, Lighthouse has seen seven more updates, further improving it, for example, by adding the new audit for agentic capabilities.
In short, while you shouldn’t take PageSpeed score as gospel, it’s an accurate representation of the experience your web pages deliver and improving it will usually also improve real page performance.
Table: PageSpeed Score vs Core Web Vitals vs Real-Life Page Speed
Here’s everything we’ve learned above in one easy-to-grasp table:
| PageSpeed score | Core Web Vitals | Real Page Speed | |
| Data source | Lab data: simulated visits from virtual devices under fixed, emulated conditions | Field data: aggregated real-world experience from Chrome users (when traffic is sufficient) | Actual experience across visitors’ devices, networks, and locations |
| What it measures | FCP, LCP, TBT, CLS, and Speed Index, combined into one score | LCP, CLS, and INP | Loading, interactivity, and visual stability, as actually experienced |
| Format | A single 0-100 score, bucketed into poor (0-49), needs improvement (50-89), and good (90-100) | Pass/fail per metric, with good / needs improvement / poor assessments | Not a score, the experience the other two metrics are trying to approximate |
| Google ranking factor? | Not directly, but reflects signals that are | Yes, since 2021 | N/A |
| Best used for | Quick diagnostics and as a stand-in when there isn’t enough traffic for field data | Judging real-world performance and SEO relevance | The actual thing you’re ultimately optimizing for |
Does PageSpeed score Matter for SEO?
PageSpeed score is not a ranking factor and does not directly determine your search positioning. But it is an indicator for how Google evaluates the performance and user experience of your web pages, and those two are ranking factors (see here and here).
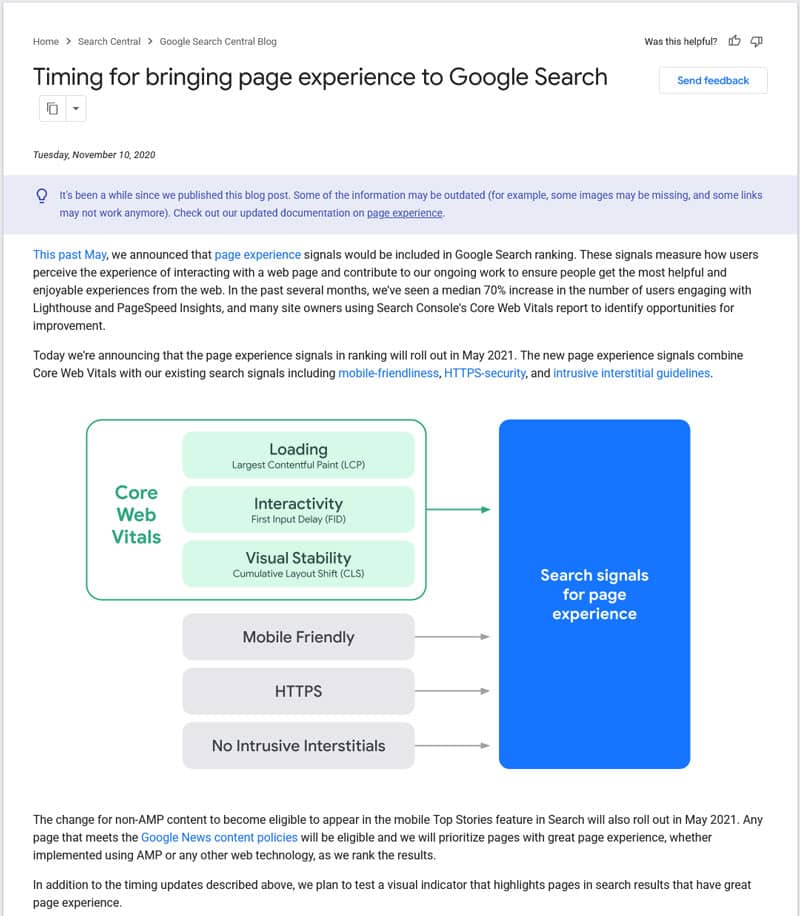
To put this into perspective, a non-optimal PageSpeed score won’t prevent you from showing up in search just as a 100/100 score doesn’t guarantee first-page positioning. The Google algorithm is a lot more complex than that, and the metrics PageSpeed Insights tracks are only one piece of the ranking puzzle.
Additionally, as we learned earlier, actual user experience matters more than and can also be different from lab data. Therefore, if your PageSpeed score is mediocre, but Core Web Vitals field data shows the page performs well in real life, the impact on your positioning in search is likely still positive.
Using lab data from PageSpeed score for SEO purposes is a good second option if you don’t have enough traffic to see field data yet. Improving it will likely also have a positive impact on actual page speed and user experience, leading to better SEO results and visitor satisfaction.
Should You Aim for a 100/100 PageSpeed Score?
Having a 100/100 score is a nice vanity metric (and it is possible to achieve) but it doesn’t need to be your end goal. User experience is a balancing act between streamlining your page as much as possible while also preserving essential features.
When a Lower Score Is Acceptable
There are many scenarios where it matters less to improve your PageSpeed score and more to ensure your page serves the needs of your visitors.
For example, many online shops and business websites now offer live chat widgets where users can ask questions about products and services or get support.

Being JavaScript-based, these widgets slow down page performance and increase Total Blocking Time. At the same time, they create real value by addressing issues, building trust, and reducing bounce rate. This often has a bigger business impact than nudging your PageSpeed score upward by a few points, meaning it makes more sense to keep the live chat feature, even if PSI flags it.
Other page features that can often take precedence over bettering your performance score are:
- E-commerce features like product filters or a multi-step checkout flow.
- Personalization through dynamic content or geotargeted offers.
- External tools such as third-party analytics or embedded booking systems.
- More complex functionality, e.g. interactive calculators or multi-language switchers.
In each of those cases, conserving the basic purpose of the page is more important than chasing a number on the screen. Plus, many features can be optimized via lazy loading, deferring, or code-splitting to shrink their impact rather than removing them outright.
When a Low PageSpeed Score Is a Problem
On the other hand, a low PageSpeed score points to real issues when it’s based on:
- Slow-loading main content: This is often caused by a sluggish server response, unoptimized images, lack of lazy loading, or unoptimized code.
- Slow page response: Frustrating to visitors trying to interact with the page and often due to resources that block the main thread.
- Layout shifts: These typically stem from images or ads without explicitly defined dimensions, or web fonts loading late.
- A non-responsive server: Delays everything downstream and points to a hosting or configuration issue.
- Render-blocking CSS/JS: Code that blocks the page from appearing in the browser. It can almost always be deferred, minified, or loaded asynchronously without hurting functionality.
- An overly large LCP image: Can be addressed by compressing or serving it in a modern format without loss of quality.
Unlike the above, these are technical implementation issues, not features that provide value to visitors. They are fixable and worsen the user experience without offering anything in return.
In the end, you should neither ignore PageSpeed score, nor adhere to it rigidly. Instead, be deliberate in where you put your efforts.
If at all possible, always aim to get a score in the green zone (90-100), it doesn’t matter whether it’s a 91 or a 99. But if you can’t reach that threshold without removing essential functionality from your page, it’s fine to stay below it. Just avoid landing in the poor (0-49) region and don’t use non-crucial features as an excuse for issues that are entirely fixable.
How to Improve Your Pages (Without Chasing a 100/100 Score)
To boost your PageSpeed score in the most effective way, address the most impactful metrics, adhere to the order of recommendations in PageSpeed Insights, and focus on mobile performance, global improvements, as well as Core Web Vitals and field data.
As we’ve discussed, PageSpeed score is calculated from a combination of different metrics. Of those, LCP, CLS, and TBT carry the most weight. So, if those are weak points on your page, improving them will make the biggest difference in the shortest time.
The help you do so, PageSpeed Insights lists individual issues detected on your page under Insights. You can even filter them by the metric they are relevant for.
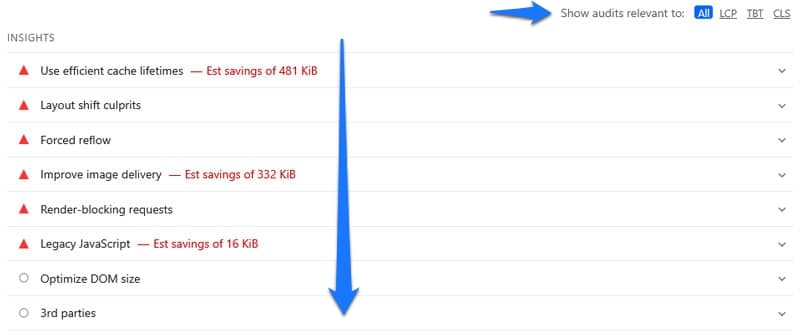
The performance insights are directly tied to PageSpeed score as well as ordered and marked by level of severity. Consequently, knocking the Use efficient cache lifetimes insight from the top of the list will improve your PageSpeed score more than eliminating the 3rd parties audit from the bottom. This gives you an order or priority.
Additionally, we know that mobile performance matters more and is also harder to optimize. At the same time, improving it usually betters your site’s desktop markers as well, so focus on issues in your mobile report first.
What’s more, some enhancements affect more than just single pages. For example, caching and compression affect your site as a whole. Implementing those before page-specific changes (e.g. reducing page DOM size), helps boost user experience and SEO on your entire website as a nice side benefit.
Finally, don’t forget that your end goal is to make your page better for actual users, not just improve a score on screen. When making changes, keep an eye on your Core Web Vitals and field data. Avoid chasing green indicators just for the sake of it; make sure your decisions tangibly benefit your visitors.
| 💡Looking to fix individual PSI performance audits? Check our Google PageSpeed Insights guide. |
FAQs on PageSpeed Score
Finally, here are answers to some common questions about this topic.
Do I need a 100/100 PageSpeed score?
No. A 100/100 is a nice vanity metric but not required. Aim for the green zone (90–100) without sacrificing essential page features like e-commerce functionality or personalization.
Does PageSpeed Insights score affect SEO?
PageSpeed score itself isn’t a ranking factor, but it reflects page performance and user experience, which Google does use in rankings. Improving it generally supports better SEO outcomes.
What matters more: PageSpeed score or Core Web Vitals?
Core Web Vitals matter more, since they’re based on real-user (field) data rather than PageSpeed score’s simulated lab data. Use PageSpeed score as a solid stand-in when you don’t have enough traffic for field data yet.
Why is my site fast but my PageSpeed score low?
PageSpeed score measures more than loading speed, it also factors in interactivity and layout stability. A page can load quickly yet still score low due to issues like layout shifts or slow response to input.
How should I prioritize PageSpeed recommendations?
Start with PSI’s own list, which ranks issues by severity. Focus on mobile performance first, field data over lab data, and prioritize global fixes over page-specific changes.
PageSpeed score: A Helpful Tool to Improve Your Page Experience
While PageSpeed score is a useful diagnostic tool. While it doesn’t reflect actual user experience, it helps you understand where your pages may fall short so you can take corrective action.
After going through the information above, you are now fully equipped to take advantage of what PageSpeed score has to offer. Just remember that achieving a 100/100 doesn’t have to be your goal. A score in the green zone, backed by solid field data, is enough to support your SEO and keep visitors happy.
For an easy way to optimize loading speed and user experience on your WordPress site, consider WP Rocket. It implements 80% of performance best practices by default and allows you to implement dozens of additional improvements with a few clicks — no coding required. Try WP Rocket free for 14 days or buy it backed by a 14-day money back guarantee and see the difference for yourself.