Table of Contents
Last update on
Are you looking for the best conversion rate optimization metrics to track? You’ve spent hours designing a beautiful website and you have polished your branding, uploaded stunning images yet visitors leave without buying, subscribing, or contacting you. Sound familiar?
You may be asking yourself: “Why are my visitors leaving? Is my site too slow? What’s wrong with my design?”
To answer these questions, you first need to understand which conversion metrics to track and what they actually reveal about your site’s performance. No more guesswork, just clear insights into what’s working, what’s slowing visitors down, and what’s preventing conversions.
In this guide, we break down the most important conversion rate optimization metrics, explain how page speed affects conversion rate, and show you how to use the right data to reduce bounce rate, improve conversions, and optimize your website for real business results.
Key Takeaways
✅ The right conversion rate optimization metrics depend on your business goals, audience, and website type.
✅ User behavior metrics help reveal friction points in your conversion funnel and customer journey.
✅ Performance metrics like loading time and Core Web Vitals directly impact user experience and conversion rates.
✅ UX and speed improvements can lead to significant engagement and revenue gains.
✅ Faster websites reduce bounce rates, improve trust, and create better customer experiences.
✅ WP Rocket is the most powerful performance plugin for WordPress and also the easiest way to improve page speed, optimize Core Web Vitals, and increase conversions.
What Are Conversion Rate Optimization Metrics?
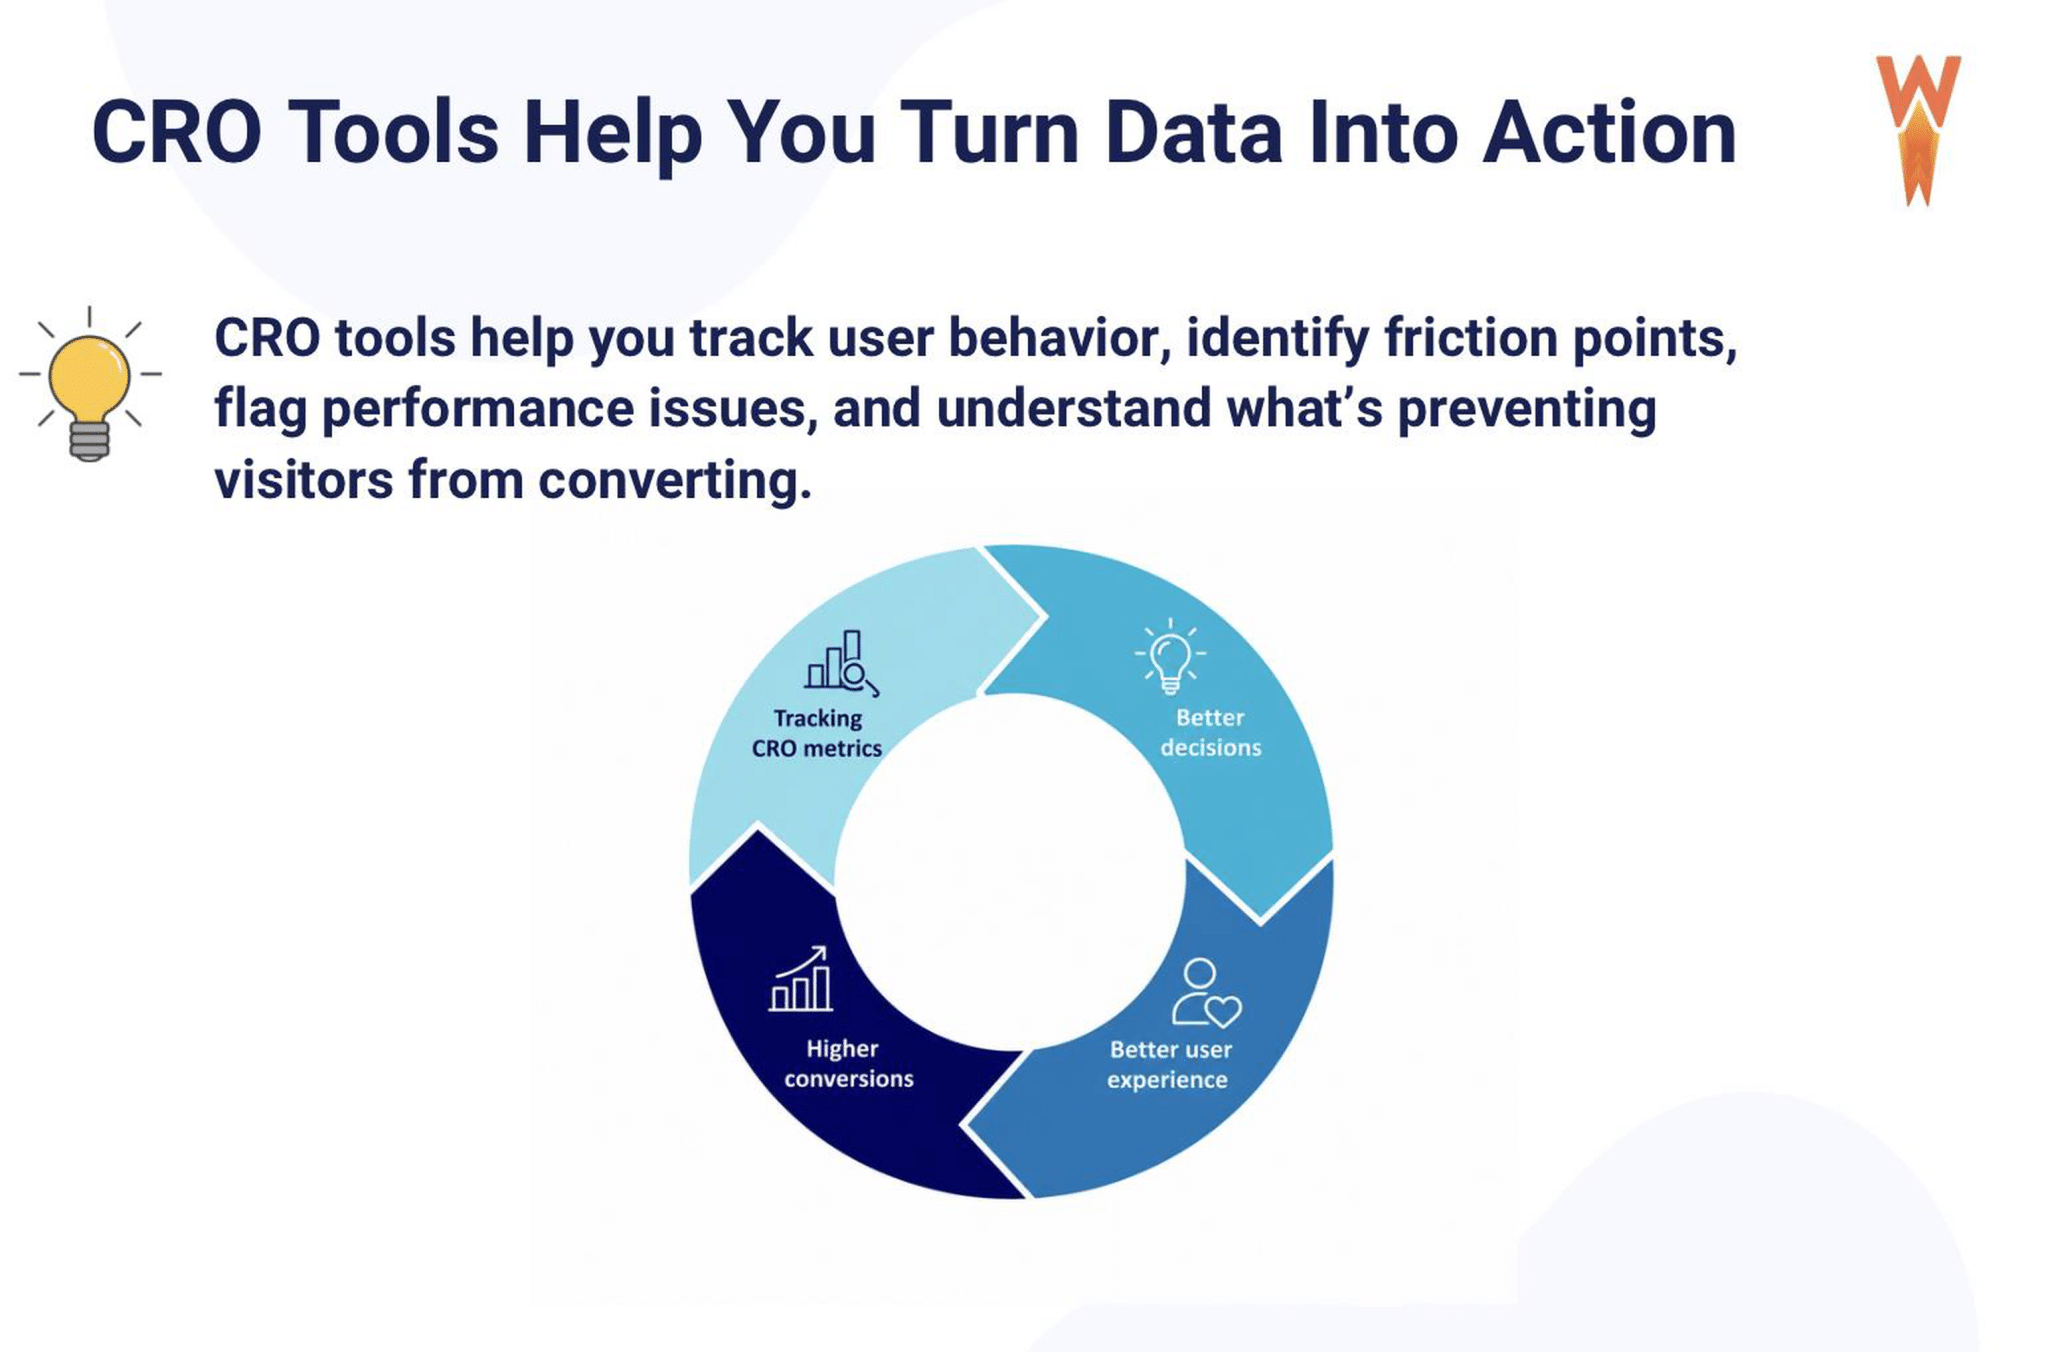
Conversion Rate Optimization (CRO) metrics help you understand how visitors interact with your website, what encourages them to convert, where they hesitate, and why they leave. These metrics help you make smarter decisions to improve user experience, website performance, and conversions.
📉 Example: Let’s say you’re monitoring website performance and conversion rate and notice that conversions suddenly drop. Instead of guessing, you check your “Shopping Cart Abandonment Rate” KPI and discover that most users leave during the final payment step. After testing the checkout flow yourself, you realize incorrect shipping fees are adding an unexpected $50 charge. Once fixed, checkout abandonment decreases and conversions improve.
| 💡 Hint: You can also read our article to better understand why users drop off during the purchasing journey. |
That’s the power of CRO metrics: they help you spot friction points before they seriously impact your revenue.
The virtuous CRO cycle below shows how better tracking leads to smarter decisions, improved user experience, and ultimately higher conversions:
How We Picked These CRO Metrics
We carefully selected CRO metrics that are actionable, easy to understand, and directly connected to user experience and business results. Most importantly, we chose metrics that lead to concrete improvements, not guesswork.
We focused on conversion metrics to track that work across different types of websites, whether you’re a blogger, freelancer, developer, web designer, agency, or a WooCommerce store owner. The goal is simple: help you identify what’s slowing users down, what’s causing friction, and what’s preventing conversions.
We also intentionally included both behavioral metrics and performance metrics because the two are deeply connected.
| 💡 Hint: Speed optimization for conversions and learning how to optimize website speed for better conversions deserve a central place in your strategy. |
Now that you understand our approach, let’s go over the CRO metrics you should be tracking.
7 Core Conversion Rate Optimization Metrics to Track and Optimize
Tracking the right conversion rate optimization metrics helps you understand what’s preventing users from converting and where your website needs improvement. Below, we break down the most important website conversion metrics to track, from user behavior to page speed and Core Web Vitals.
1. Conversion Rate
Conversion rate measures the percentage of visitors who complete a desired action on your website. Depending on your goals, a conversion can be a purchase, form submission, newsletter signup, account creation, or download.
🎯 Why It Matters for Conversions
This is the most important CRO metric because it directly shows whether your website successfully turns visitors into customers or leads. A low conversion rate often means that users experience friction during their journey or that your pages are not meeting their expectations.
💰 Impact on User Experience and Revenue
Improving your conversion rate can significantly increase revenue without needing more traffic. Even small UX improvements, such as clearer calls to action, faster pages, or simplified forms, can have a direct impact on conversions.
📊 How to Measure It
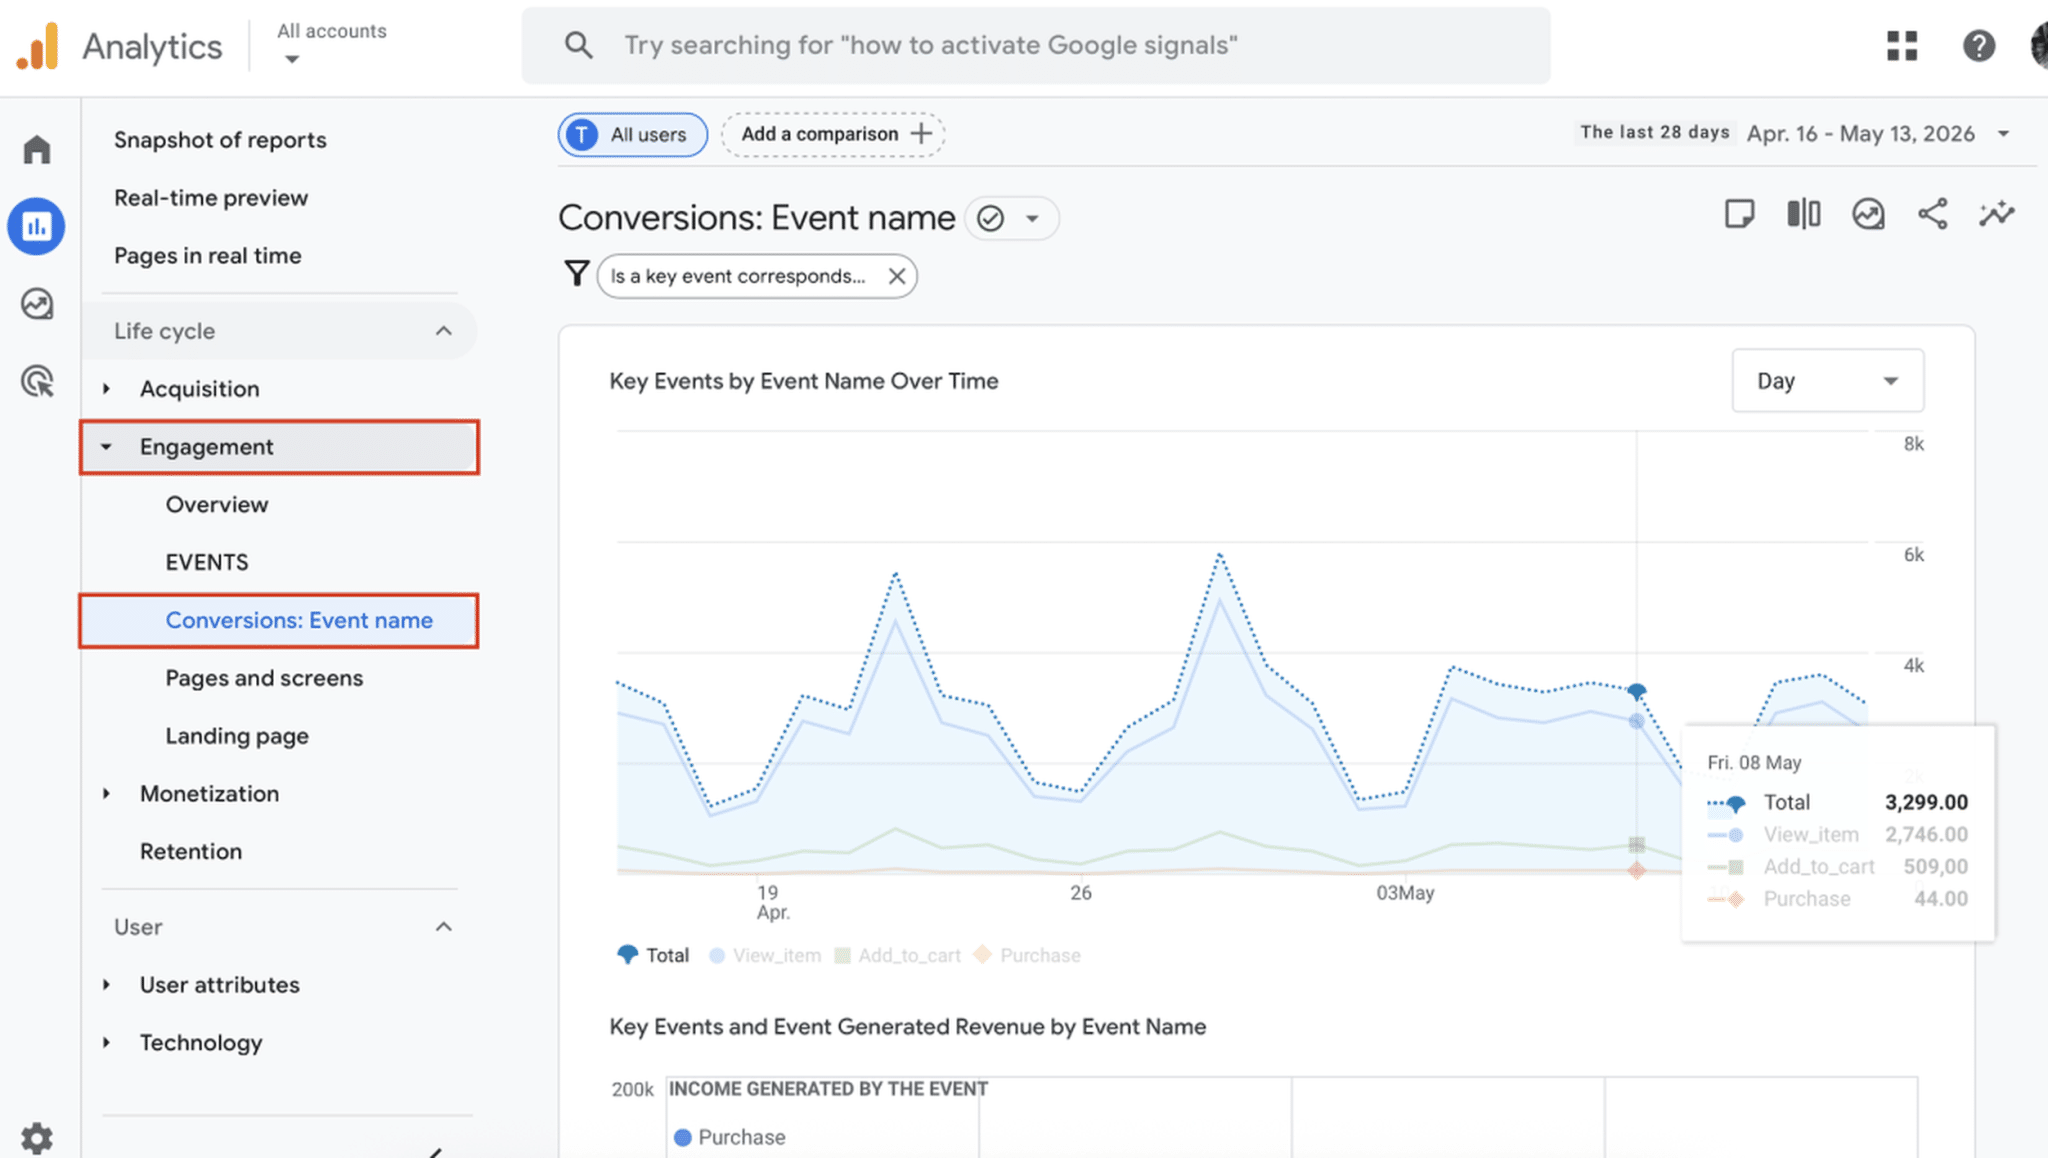
You can measure conversion rate in Google Analytics 4 by setting up key events or conversions. Most ecommerce platforms, including WooCommerce, Shopify, and SaaS tools, also provide conversion tracking dashboards.
In GA4, go to Reports > Engagement > Conversions (event name):
You can also use the simple formula:
Conversion Rate = (Conversions ÷ Total Visitors) × 100
✅ Best Practices to Improve It
- Simplify the conversion journey.
- Improve page speed and mobile experience.
- Use clear calls to action.
- Reduce distractions on landing pages.
- Build trust with reviews, guarantees, and secure checkout elements.
- Optimize forms and checkout pages.
🛠️ Best Tools
- WP Rocket: to improve page speed and user experience.
- Google Analytics 4: to track conversions, funnels, and user behavior.
- Hotjar: to visualize user behavior with heatmaps and recordings.
- Optimizely: to run A/B testing experiments.
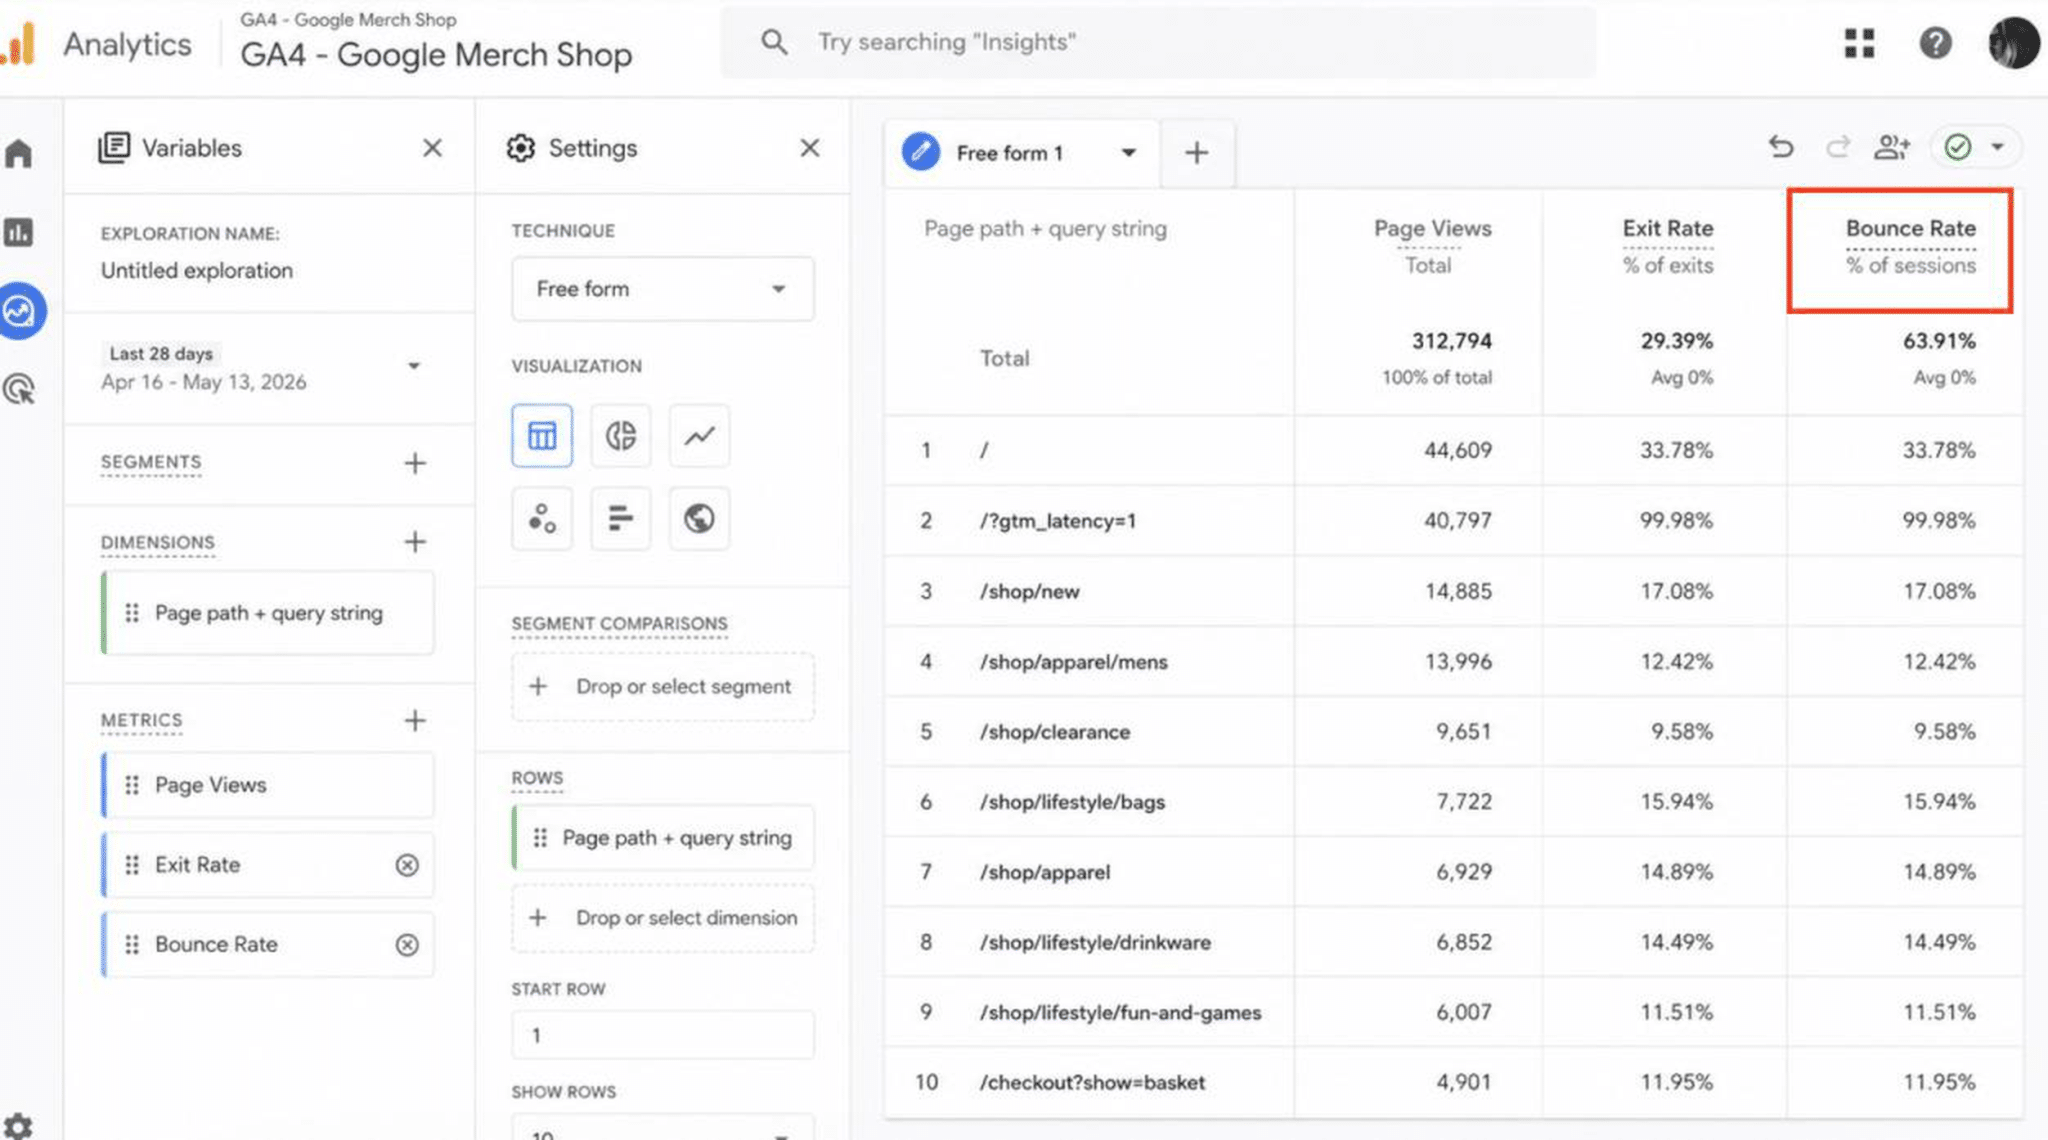
2. Bounce Rate
Bounce rate measures the percentage of users who leave your website after viewing only one page without interacting further.
🎯 Why It Matters for Conversions
A high bounce rate may indicate that visitors are not finding what they expected, that the page loads too slowly, or that the user experience is poor.
💰 Impact on User Experience and Revenue
If users leave immediately, they never reach your products, offers, or conversion pages. High bounce rates can reduce engagement, decrease trust, and lower your conversion potential.
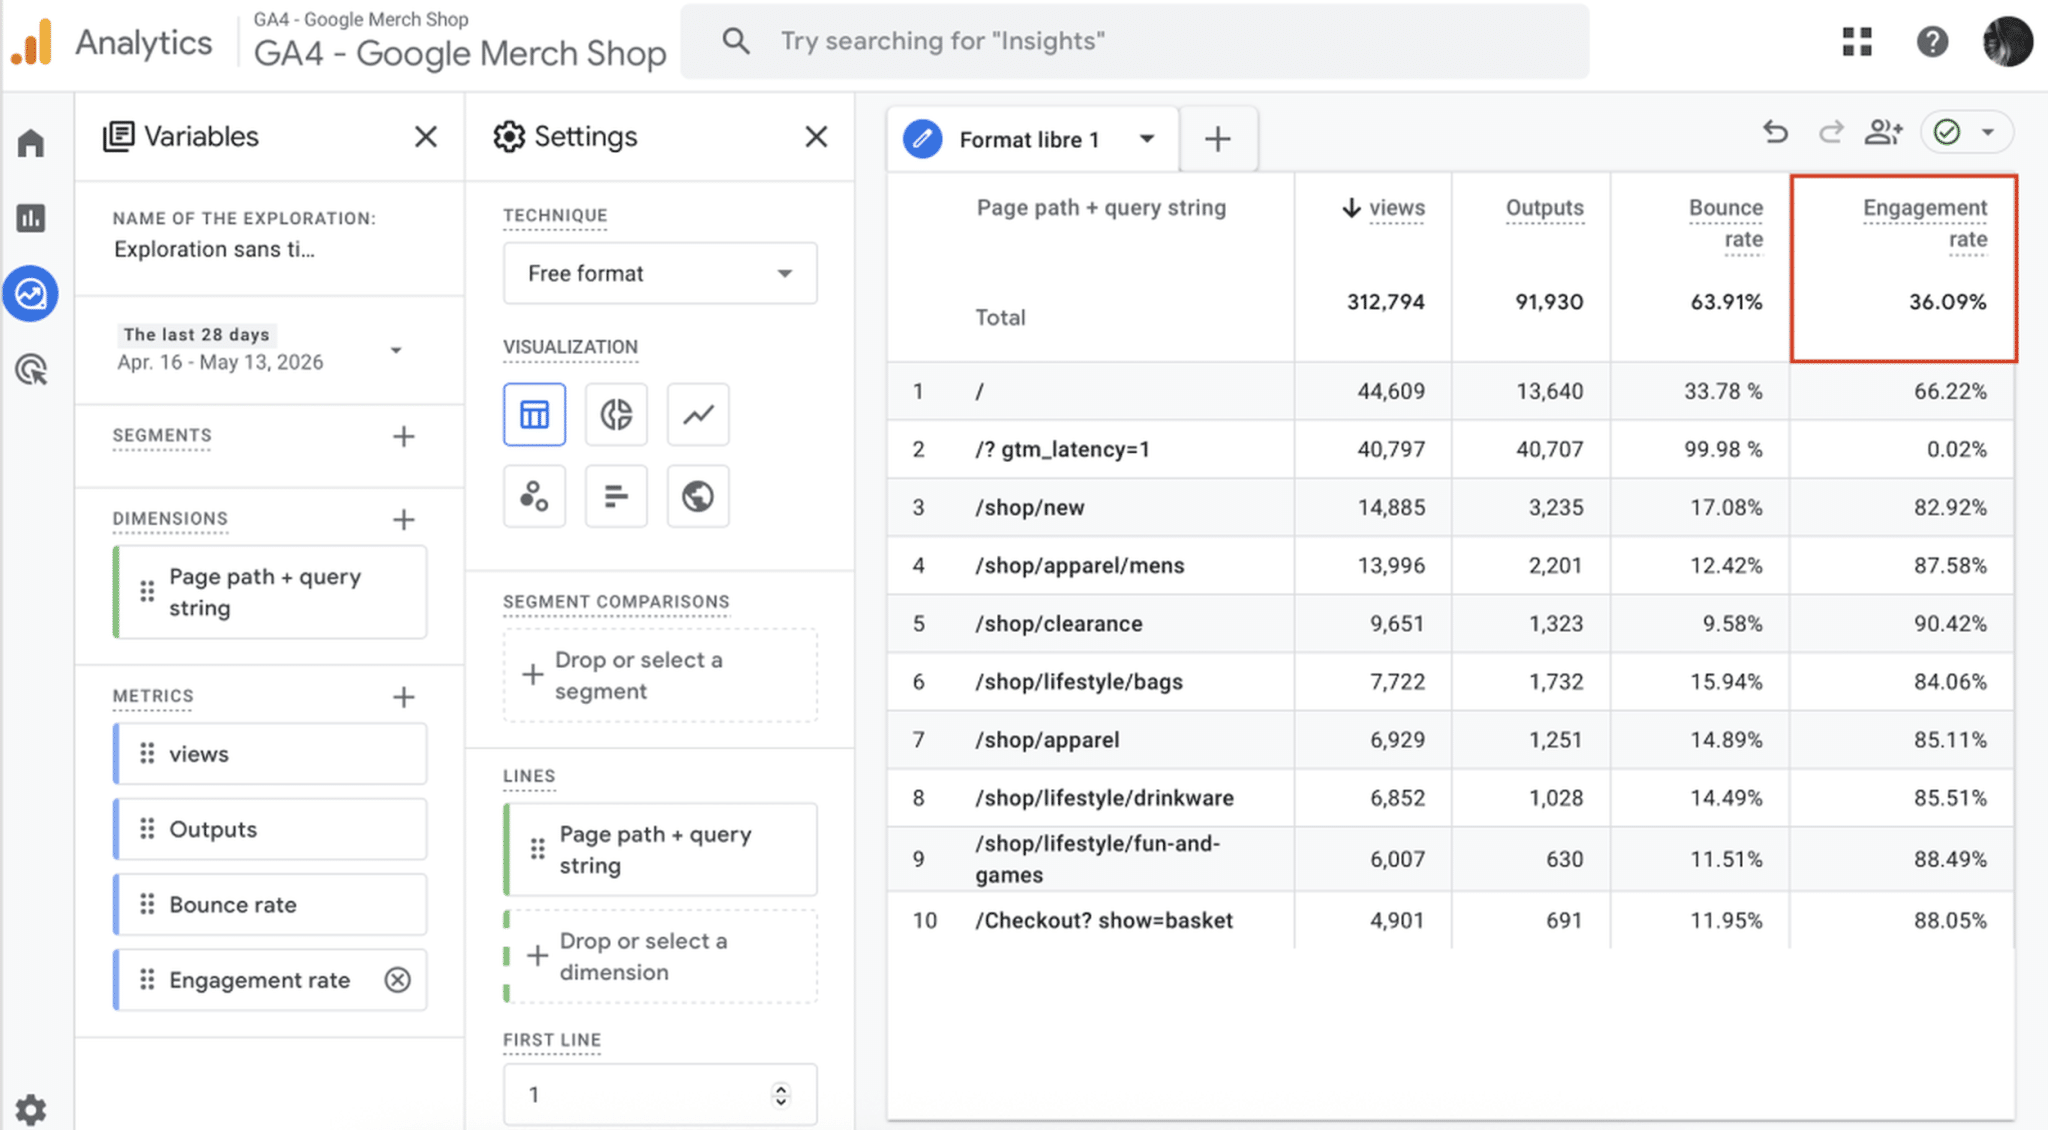
📊 How to Measure It
You can monitor bounce rate in Google Analytics 4 under engagement reports. It is especially useful to compare bounce rates across devices, traffic sources, and landing pages.
✅ Best Practices to Improve It
- Improve loading speed.
- Match content with search intent.
- Create engaging introductions and visuals.
- Improve mobile usability.
- Add internal links and clear navigation.
- Reduce intrusive popups.
🛠️ Best Tools
- WP Rocket: to improve loading speed and navigation fluidity.
- Google PageSpeed Insights: to identify speed-related performance issues.
- Google Analytics 4: to analyze bounce rates and engagement.
- Hotjar: to identify friction points with heatmaps.
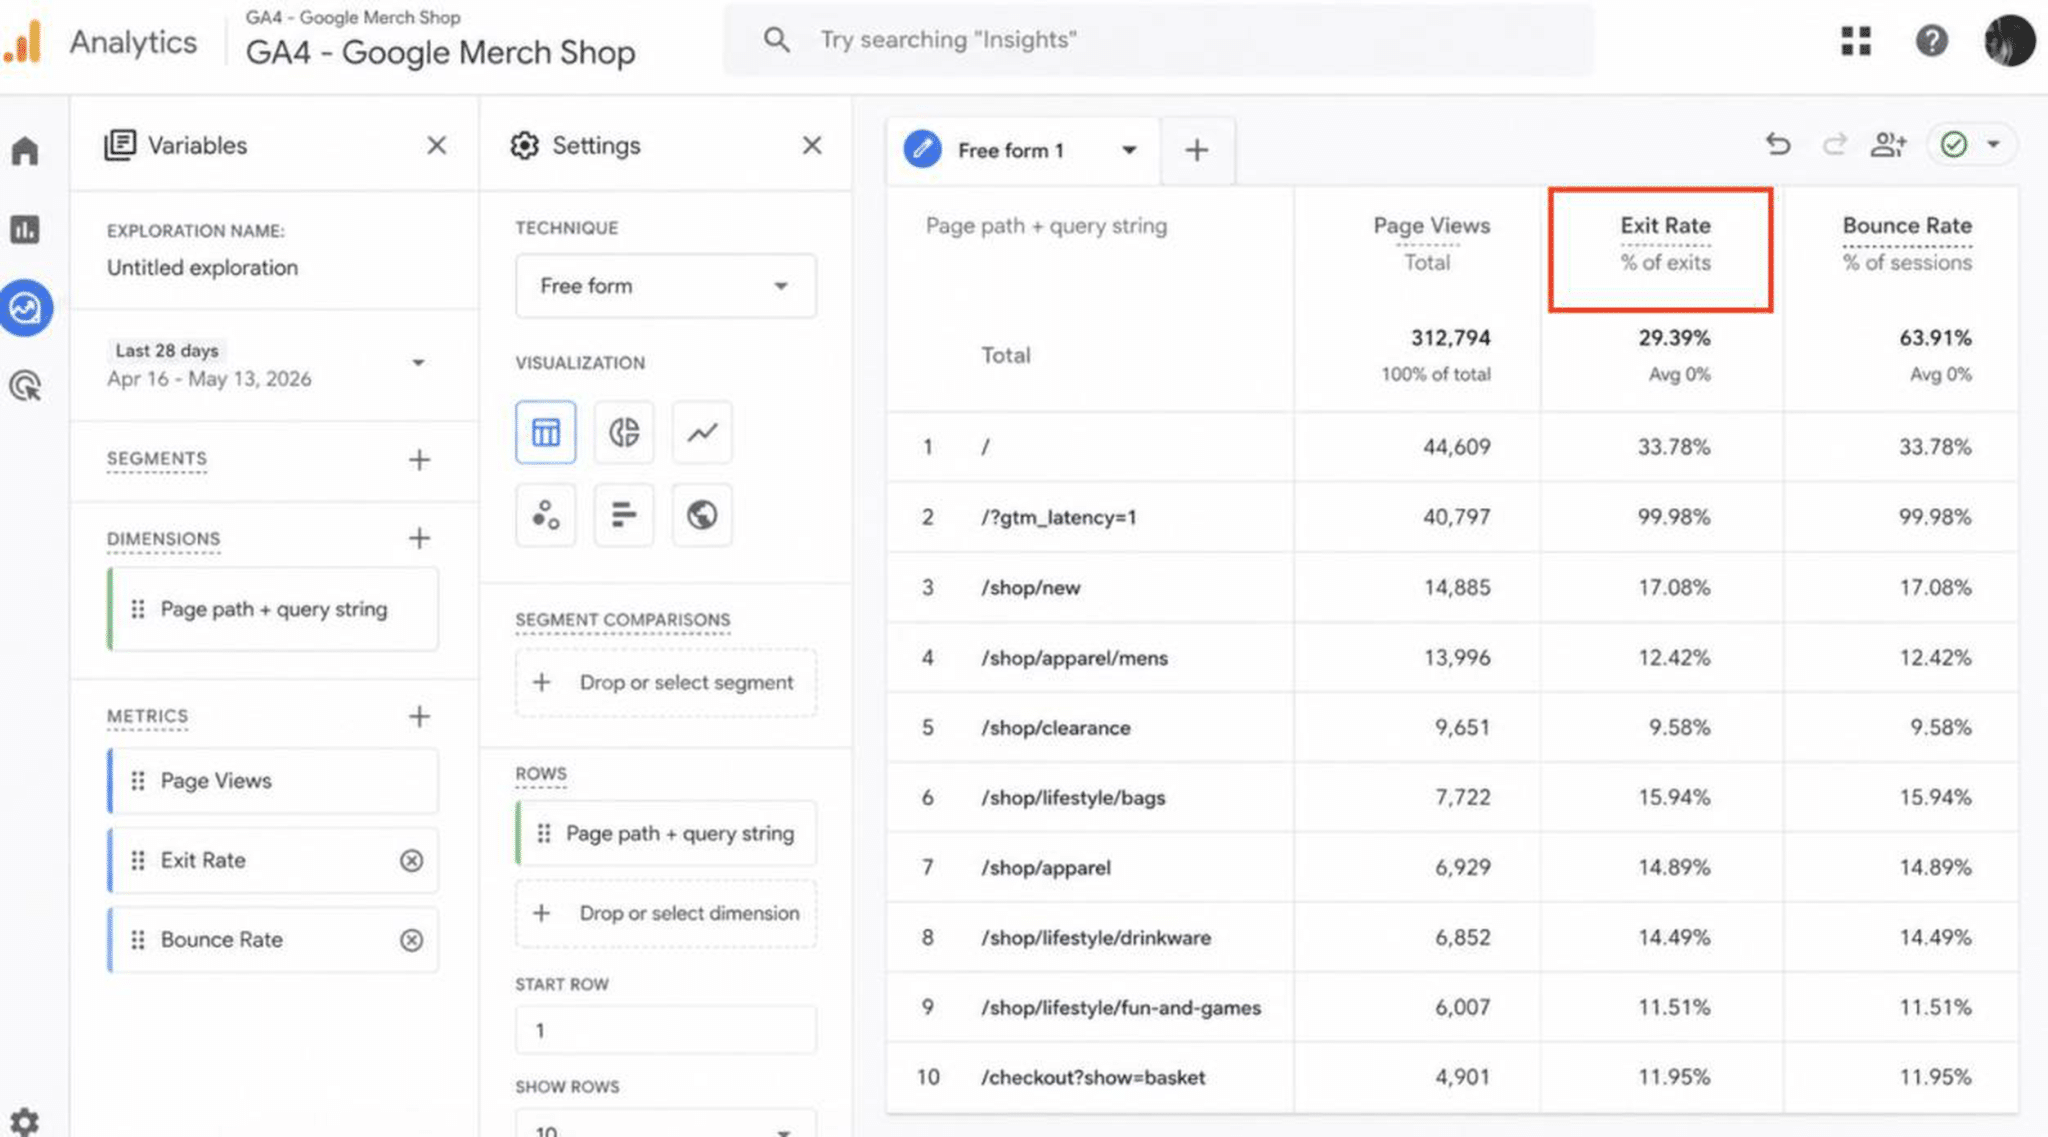
3. Exit Rate
Exit rate measures the percentage of users who leave your website from a specific page.
🎯 Why It Matters for Conversions
Unlike bounce rate, exit rate helps you identify where users abandon their journey. This is especially useful for finding friction points in checkout flows, forms, or important landing pages.
💰 Impact on User Experience and Revenue
A high exit rate on key pages can directly hurt conversions and revenue. For example, if users consistently leave on the payment page, there may be trust, pricing, or performance issues.
📊 How to Measure It
Google Analytics 4 allows you to analyze page exits and user paths. Funnel exploration reports are particularly useful for identifying drop-off points.
✅ Best Practices to Improve It
- Improve page speed on critical pages.
- Simplify forms and checkout steps.
- Add trust signals and transparent pricing.
- Fix technical or mobile usability issues.
- Improve clarity and calls to action.
🛠️ Best Tools
- WP Rocket: to optimize page speed on critical conversion pages.
- Google Analytics 4: to monitor user paths and drop-off points.
- Hotjar Funnels: to visualize where users abandon the journey.
4. Click-Through Rate (CTR)
Click-through rate measures the percentage of users who click on a specific link, button, email, ad, or call to action.
🎯 Why It Matters for Conversions
CTR helps you understand whether your messaging, design, and calls to action are effective enough to encourage interaction.
💰 Impact on User Experience and Revenue
A higher CTR means more users move further into your conversion funnel. Improving button visibility, copywriting, and page speed can positively impact engagement and conversions.
📊 How to Measure It
CTR can be tracked in Google Analytics 4, Google Search Console, advertising platforms, email marketing tools, and heatmap software. Here’s an example of click maps from Hotjar:

Formula:
CTR = (Total Clicks ÷ Total Impressions) × 100
✅ Best Practices to Improve It
- Write clearer calls to action.
- Improve button design and visibility.
- Optimize headlines and metadata.
- Improve loading speed.
- Reduce visual clutter.
- Test different layouts and wording.
🛠️ Best Tools
- WP Rocket: to improve loading speed for faster interaction.
- Google Search Console: to monitor organic CTR and search performance.
- Google Analytics 4: to track clicks and user engagement.
- Hotjar: to analyze user interaction patterns.
- Optimizely: to test different CTA designs and copy.
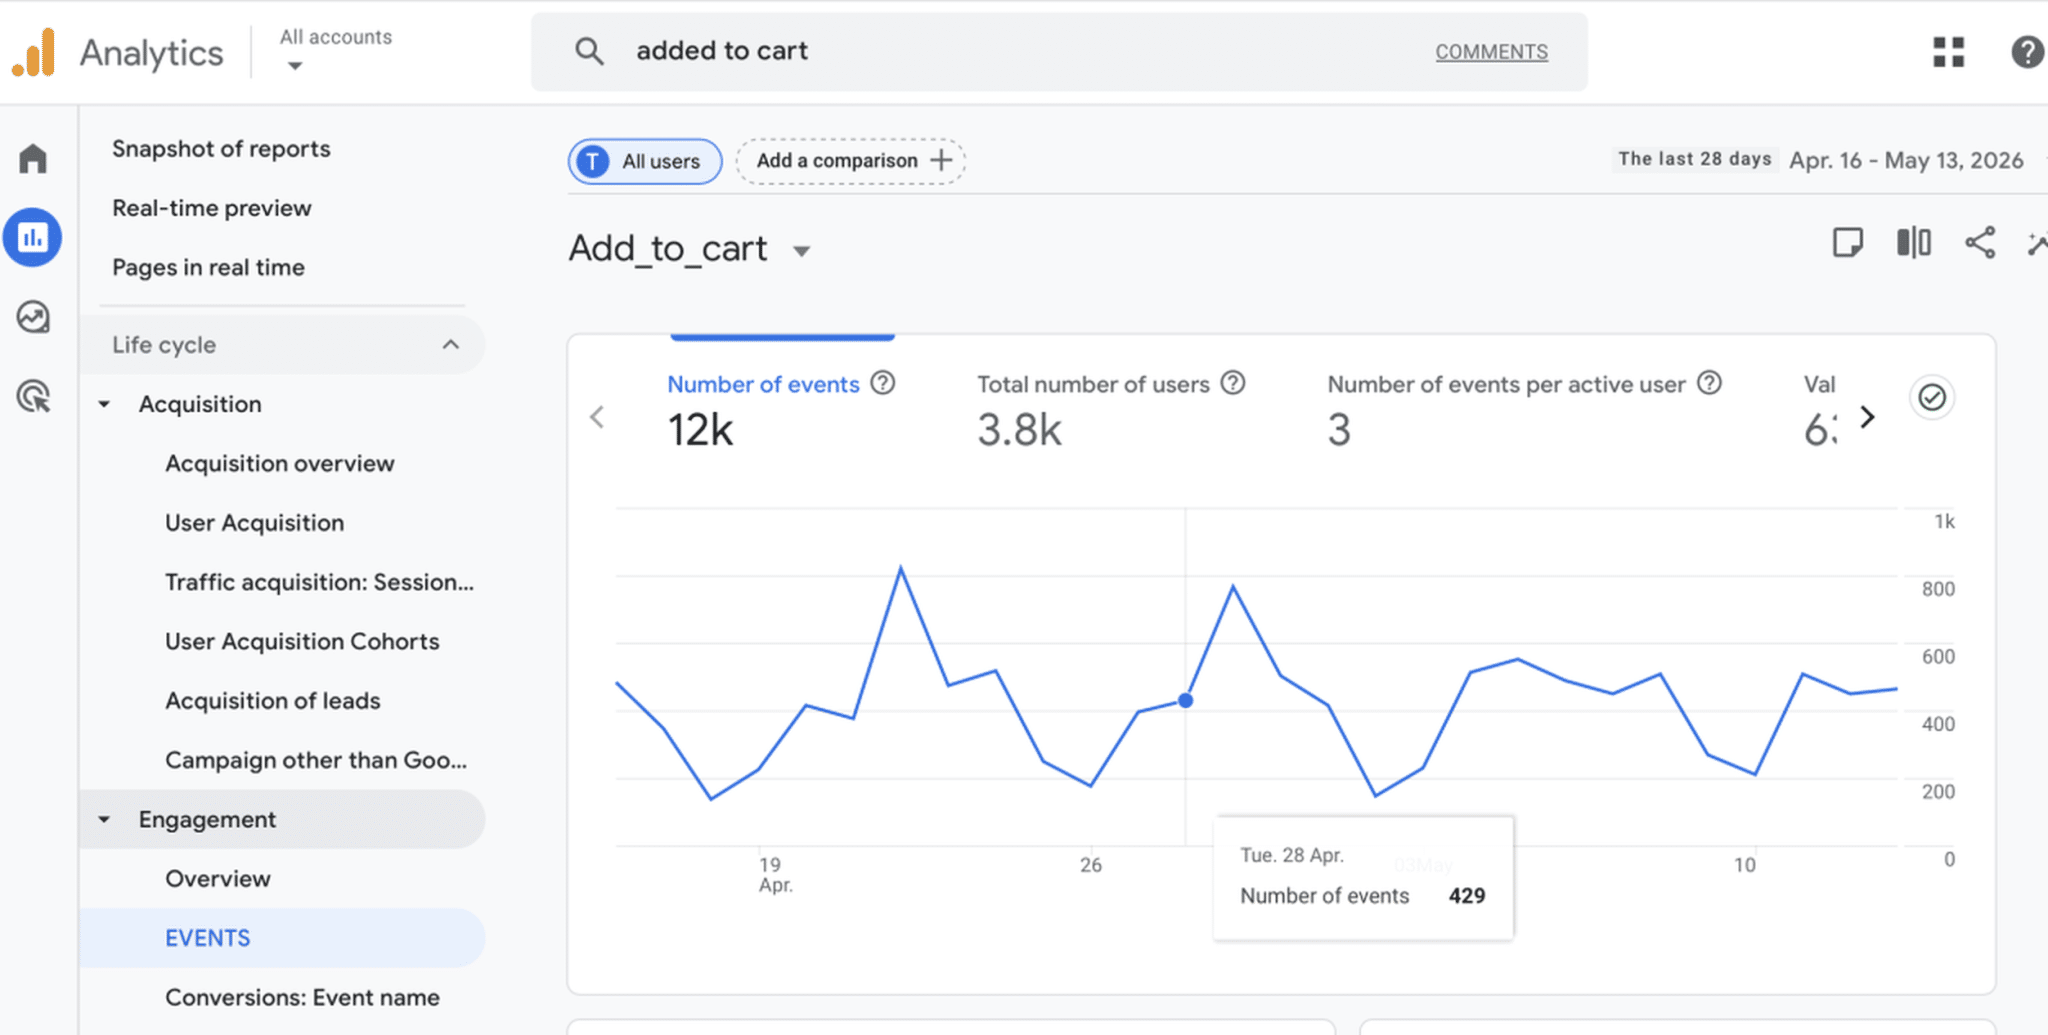
5. Add-to-Cart Rate
Add-to-cart rate measures the percentage of visitors who add a product to their shopping cart.
🎯 Why It Matters for Conversions
This metric helps ecommerce and WooCommerce store owners understand whether product pages successfully encourage purchase intent.
💰 Impact on User Experience and Revenue
A low add-to-cart rate may indicate issues with product descriptions, pricing, trust, mobile usability, or page speed.
📊 How to Measure It
Most ecommerce platforms and Google Analytics 4 ecommerce reports allow you to track add-to-cart actions. You can create custom events such as “Add to cart” and see the progress of the KPI:
Formula:
Add-to-Cart Rate = (Add-to-Cart Actions ÷ Total Visitors) × 100
✅ Best Practices to Improve It
- Improve product images and descriptions.
- Display reviews and trust signals.
- Simplify product options.
- Improve mobile experience.
- Speed up product pages.
- Make the Add to Cart button more visible.
🛠️ Best Tools
- WP Rocket: to accelerate product page loading times.
- Google Analytics 4: to track ecommerce actions and funnels.
- WooCommerce Analytics: to monitor product and cart performance.
- Hotjar: to understand product page behavior.
- Fomo: to increase urgency and trust with social proof notifications.
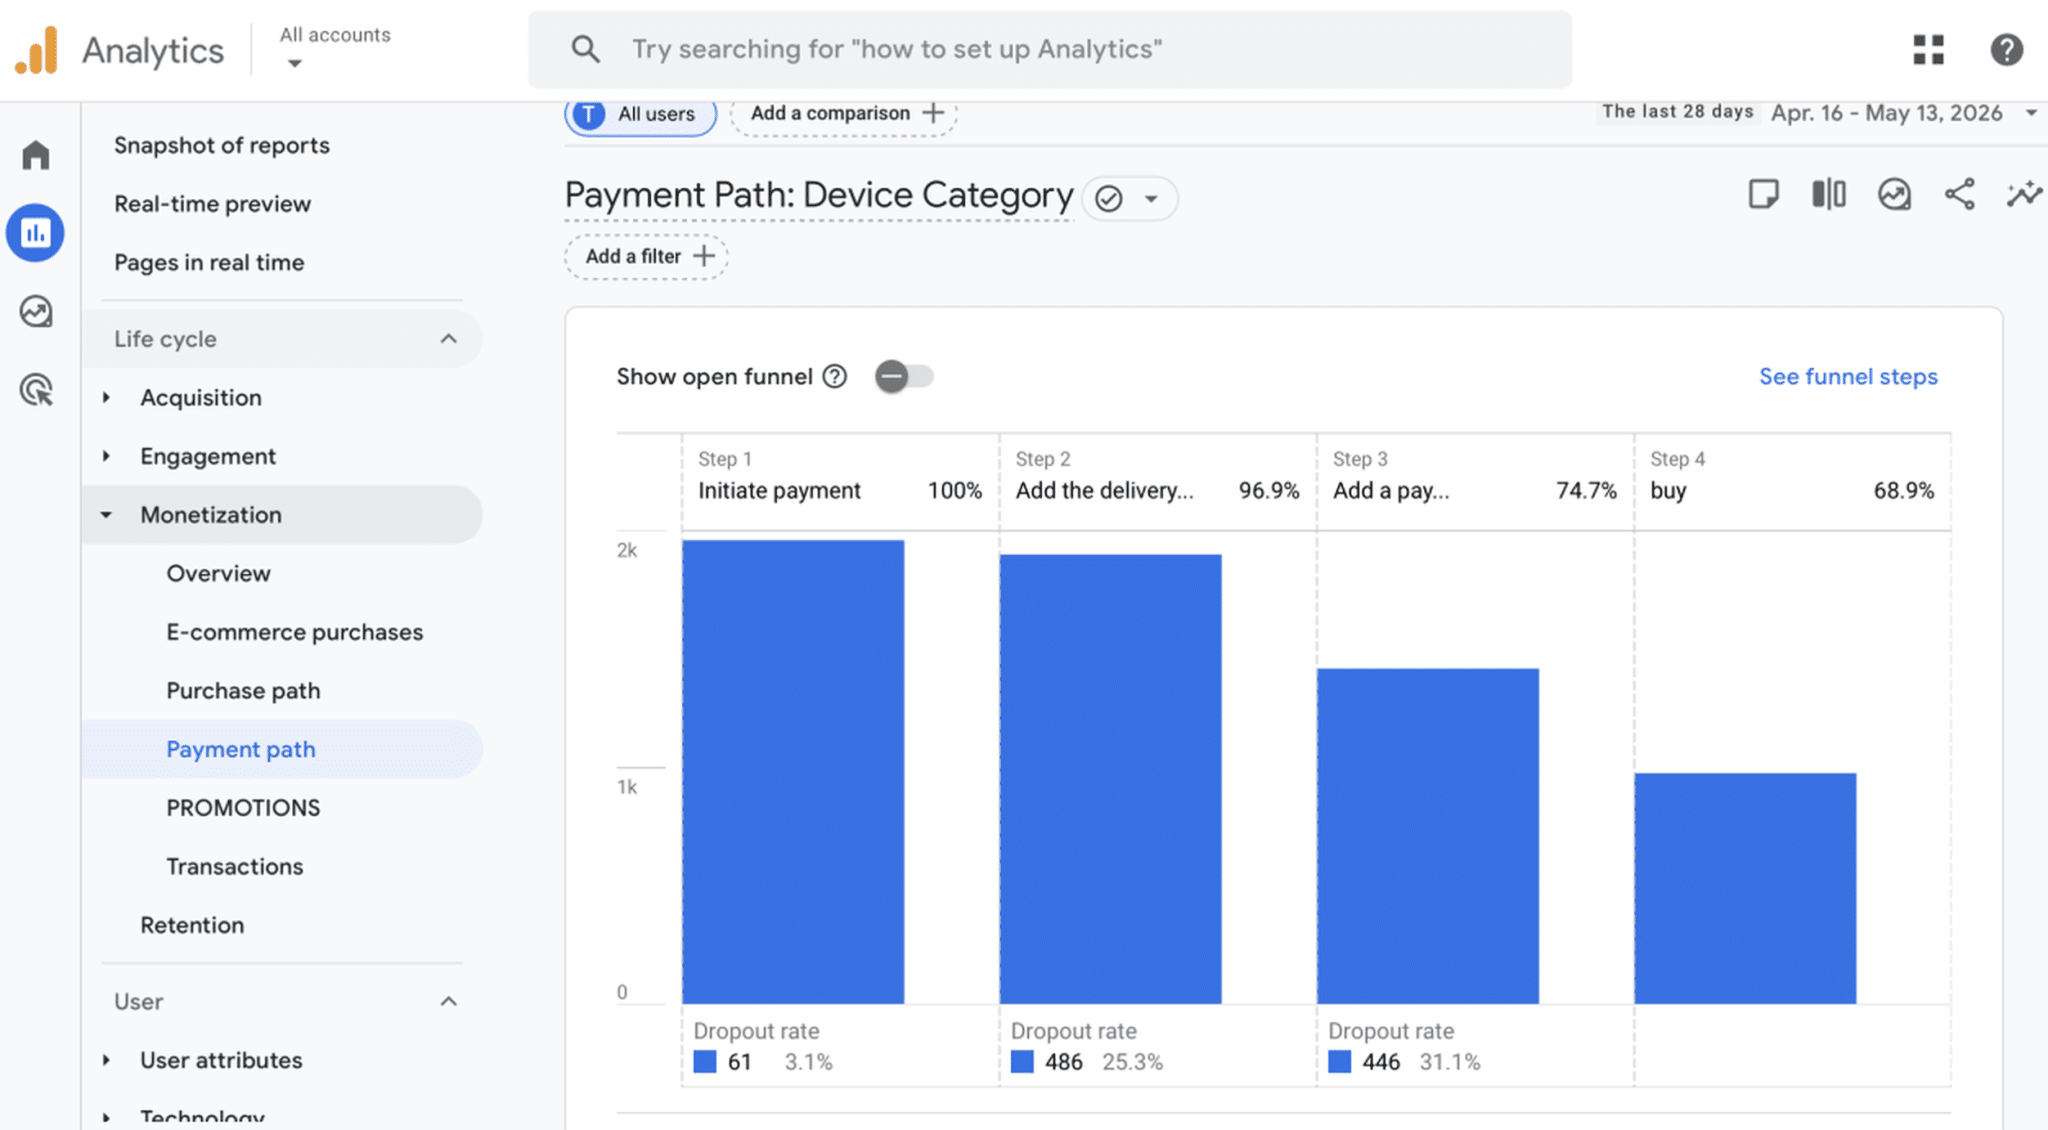
6. Cart Abandonment Rate
Cart abandonment rate measures the percentage of users who add products to their cart but leave without completing the purchase.
🎯 Why It Matters for Conversions
This metric directly impacts ecommerce revenue. It helps identify checkout friction and purchasing obstacles.
💰 Impact on User Experience and Revenue
Unexpected shipping fees, slow checkout pages, mandatory account creation, or payment issues can significantly increase abandonment rates.
📊 How to Measure It
You can monitor cart abandonment using Google Analytics 4 funnel reports, WooCommerce analytics, or ecommerce dashboards.
From GA4, you can check where users leave from Monetization > Payment path:
Formula you can use:
Cart Abandonment Rate = (Abandoned Carts ÷ Initiated Checkouts) × 100
✅ Best Practices to Improve It
- Simplify checkout steps.
- Improve checkout speed.
- Offer guest checkout.
- Display transparent pricing.
- Add secure payment badges.
- Optimize mobile checkout experience.
🛠️ Best Tools
- WP Rocket: to optimize checkout page performance.
- Google Analytics 4: to identify checkout abandonment points.
- WooCommerce Analytics: to monitor checkout and cart data.
- WooCommerce Stripe Payment Gateway: to offer faster and secure card payments.
- Stripe Dashboard: to analyze payment-related drop-offs.
- Hotjar Funnels: to visualize checkout friction.
7. Time on Page / Engagement Time
Time on page, also called engagement time in GA4, measures how long users actively interact with your content.
🎯 Why It Matters for Conversions
This metric helps you understand whether visitors find your content engaging, useful, and easy to consume.
💰 Impact on User Experience and Revenue
Low engagement time can signal poor content quality, slow loading times, confusing layouts, or weak user experience.
📊 How to Measure It
Google Analytics 4 provides engagement metrics across pages and devices. Heatmaps and session recordings can also provide additional context.
✅ Best Practices to Improve It
- Improve content readability.
- Use engaging visuals and headings.
- Improve page speed.
- Optimize mobile usability.
- Add videos, FAQs, and interactive elements.
🛠️ Best Tools
- Hotjar: to analyze scrolling and interaction behavior.
- Figma: to create a pixel-perfect design.
- WP Rocket: to improve perceived loading speed and user experience.
- Contentsquare: to visualize engagement and content interaction.
💡 Note: The 7 CRO optimization areas above cover the main techniques used to improve user experience and conversions. However, there are two additional performance metrics that are closely tied to conversion rate optimization: Core Web Vitals (CWV) and page loading time.
Bonus #1: Core Web Vitals
Core Web Vitals are Google’s performance metrics focused on loading speed, visual stability, and interactivity.
The three Core Web Vitals are:
- Largest Contentful Paint (LCP).
- Cumulative Layout Shift (CLS).
- Interaction to Next Paint (INP).
🎯 Why It Matters for Conversions
Core Web Vitals directly impact user experience and are part of Google’s ranking algorithm. Poor scores can make your website feel slow, unstable, or frustrating to use. If customers can’t easily find your website in search results, they’ll never have the opportunity to convert.
💰 Impact on User Experience and Revenue
Improving Core Web Vitals can reduce bounce rates, increase engagement, improve SEO visibility, and support better conversions.
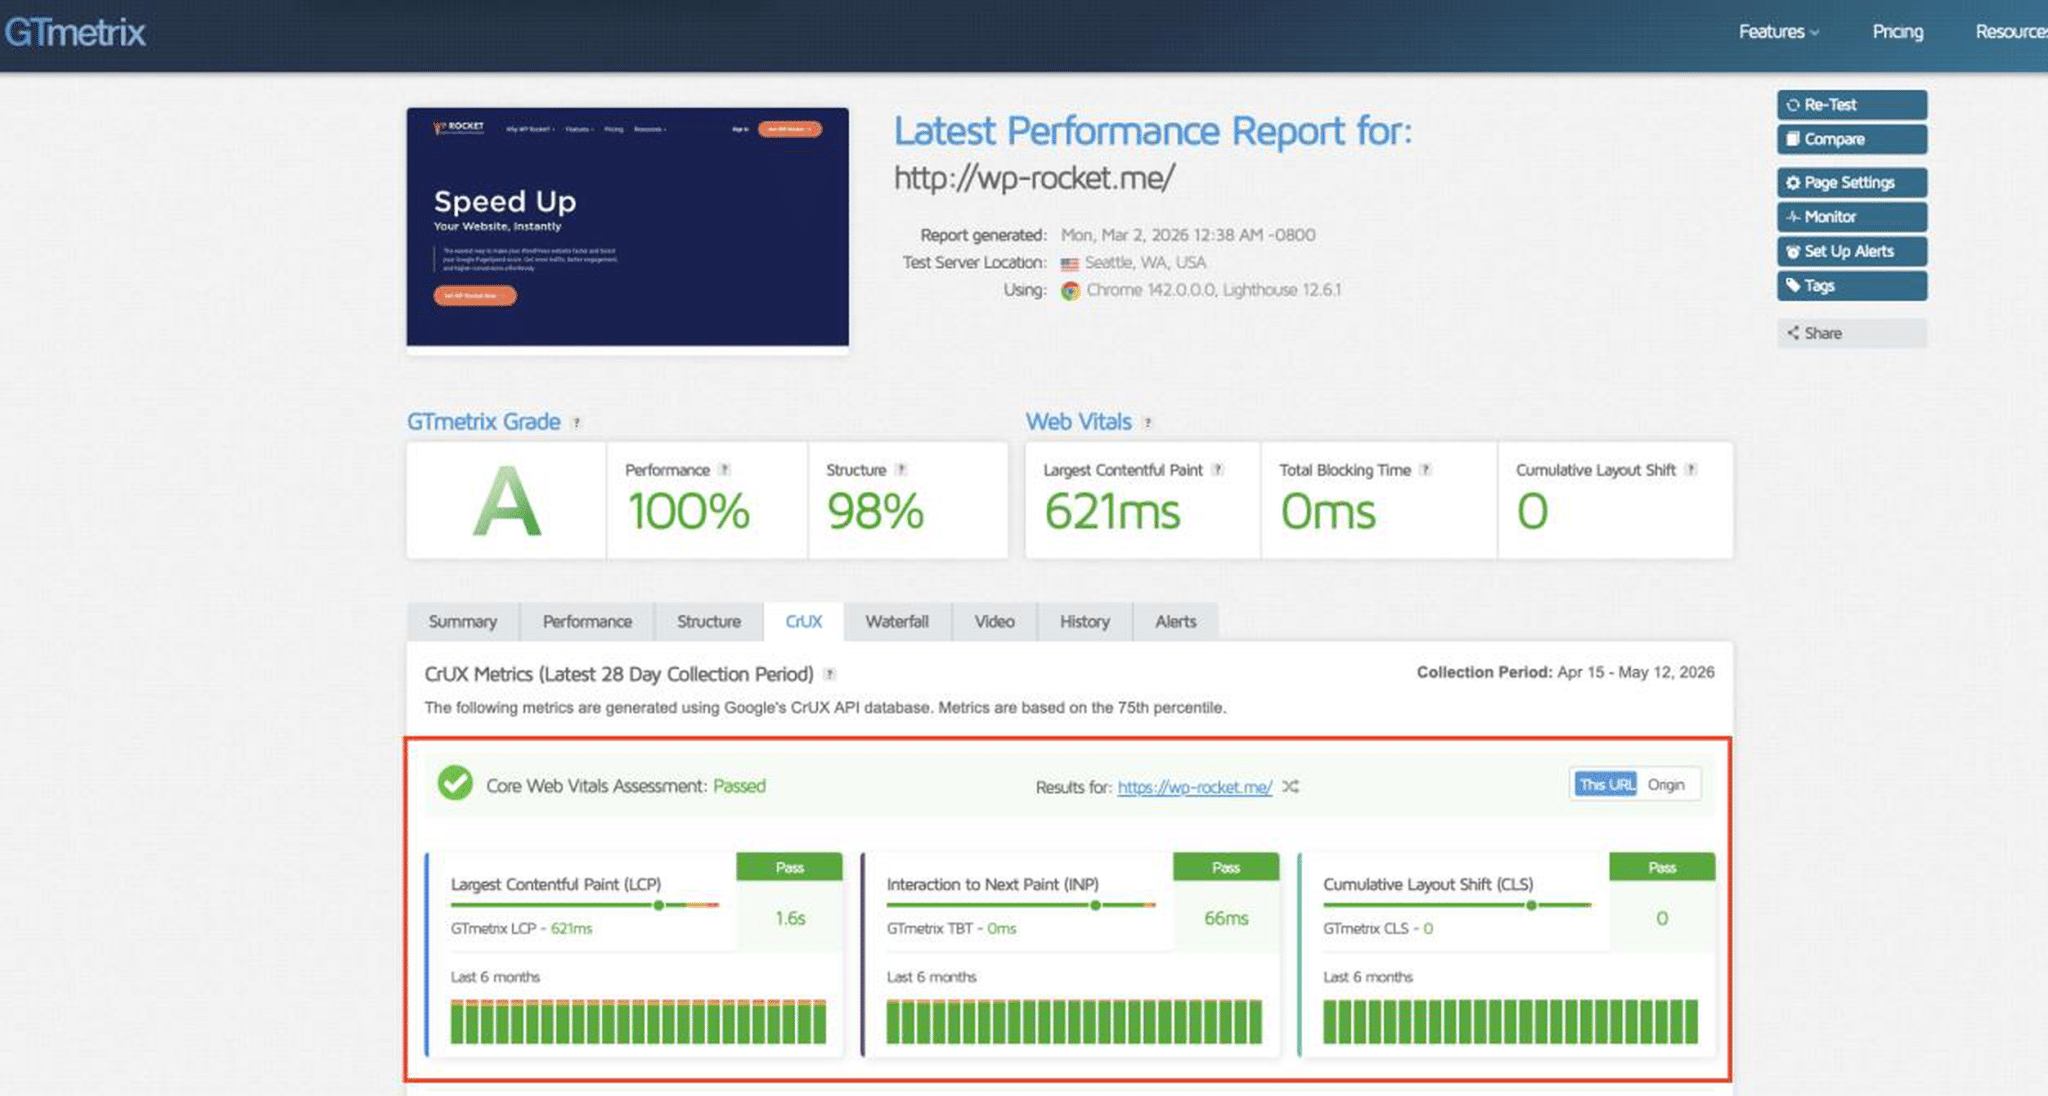
📊 How to Measure It
You can measure Core Web Vitals using GTmetrix, Rocket Insights, and Google PageSpeed Insights. GTmetrix is particularly useful because it provides advanced waterfall charts and detailed loading analysis beyond the standard PSI score:
✅ Best Practices to Improve It
- Choose fast and reliable hosting
- Enable caching.
- Optimize critical scripts and images that need to be rendered first
- Implement lazy loading for images that are not in the viewport.
- Delay non-essential JavaScript.
- Remove unused CSS.
- Avoid intrusive popups and banners that push content down.
- Reduce heavy database queries and clean your database.
🛠️ Best Tools
- WP Rocket: to implement caching, optimize critical images and scripts, delay non-essential JavaScript, apply lazy loading, remove unused CSS, clean the database among other optimizations.
- RocketCDN: to speed up global content delivery.
- Imagify: to optimize images and reduce loading times.
Bonus #2: Page Loading Time
Loading time measures how long a webpage takes to fully display its content. It’s not a proper CRO metric but your visitors will be more likely to convert on a fast site rather than a slow site.
🎯 Why It Matters for Conversions
Page speed has a direct impact on user experience, engagement, and conversion rates. Slow websites frustrate users and increase abandonment.
💰 Impact on User Experience and Revenue
A slow-loading website can reduce trust, hurt SEO visibility, increase bounce rates, and lower conversions — especially on mobile devices.
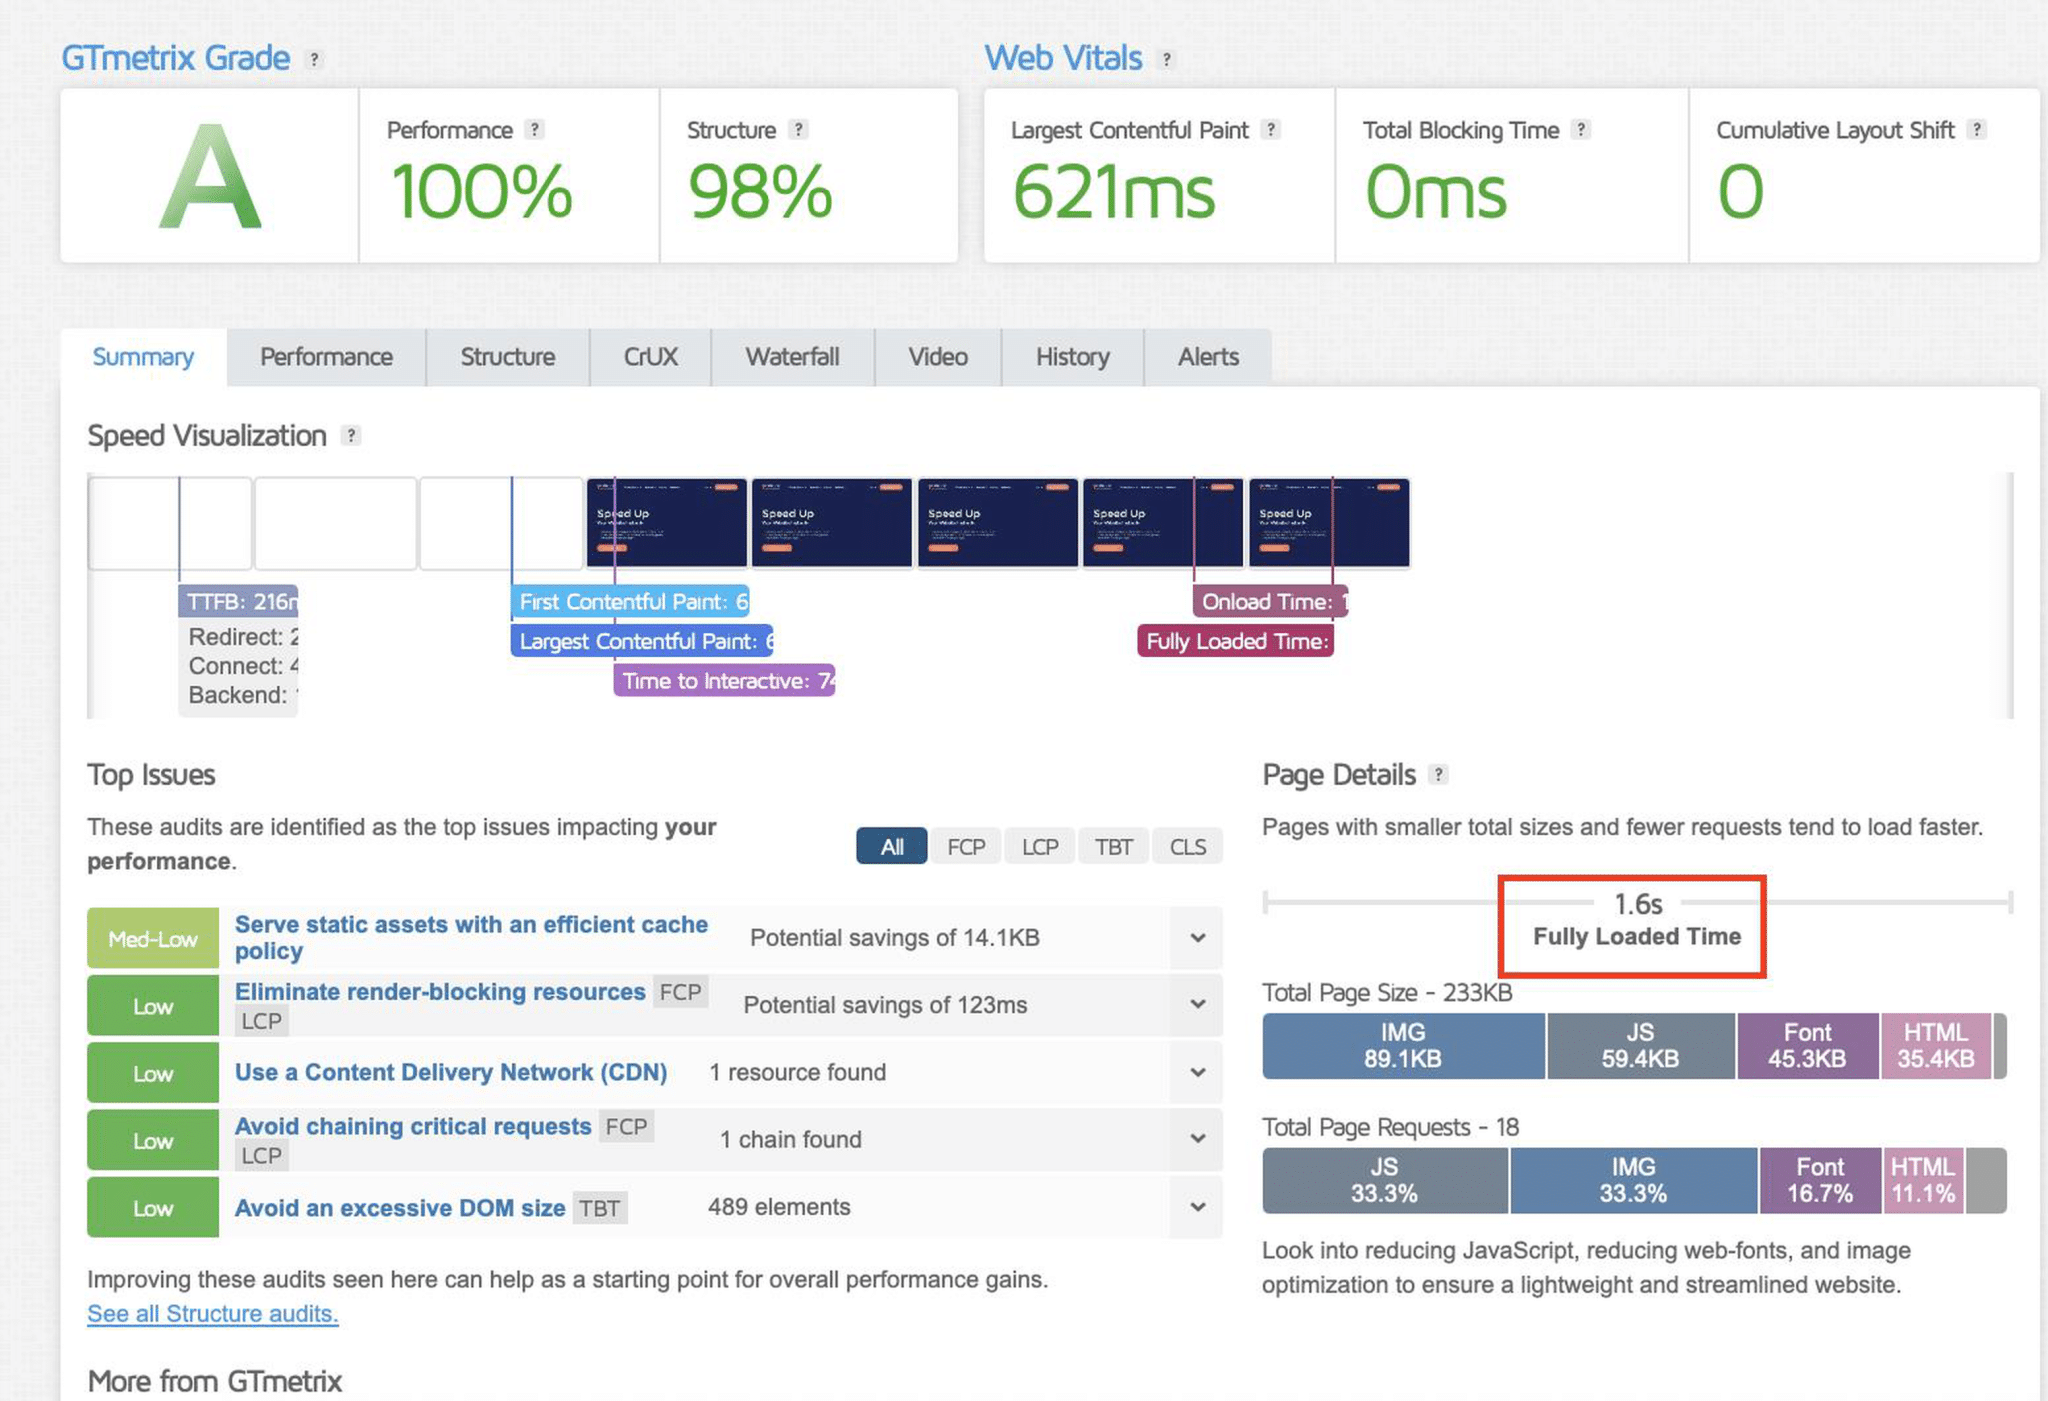
📊 How to Measure It
You can measure loading time using GTmetrix, Rocket Insights, or WebPageTest. GTmetrix provides more advanced technical analysis, including page load breakdowns, Core Web Vitals, waterfall charts, code and image weight analysis, plus performance monitoring by device and geographic location.
✅ Suggested optimizations
- Enable caching and preloading.
- Compress images and convert them to WebP or AVIF (next-gen formats).
- Minify CSS and JavaScript.
- Delay non-essential scripts.
- Remove unused CSS.
- Implement lazy loading
- Enable a CDN if you have traffic worldwide.
🛠️ Best Tools
- WP Rocket: to apply caching and preloading, lazy loading, code optimization (minification and unused CSS removal), image optimization support, and delayed JavaScript execution. These features are just a part of the many optimizations that can improve loading times and Core Web Vitals even more.
- Imagify: to easily compress images without impacting quality and convert them to next-gen formats automatically.
- RocketCDN: to improve global loading speed through content delivery.
CRO Metrics Comparison Table
More of a visual learner? The table below gives you a quick overview of the most important conversion rate optimization metrics, what they measure, and how they impact conversions.
| CRO Metric | Impact on Conversions | Best Tools to Measure or Improve it |
| Conversion Rate | Reveals how effectively your website turns visitors into customers or leads | WP Rocket, Google Analytics 4, Hotjar |
| Bounce Rate | Reveals engagement, UX, or loading speed issues preventing users from exploring the site | WP Rocket, Google Analytics 4, PageSpeed Insights |
| Exit Rate | Reveals friction points in forms, checkout flows, or landing pages | Google Analytics 4, Hotjar Funnels |
| Click-Through Rate (CTR) | Reveals how effective your messaging, design, and calls to action are | Google Analytics 4, Search Console, Optimizely |
| Add-to-Cart Rate | Reveals how convincing and optimized your product pages are | WooCommerce Analytics, Hotjar |
| Cart Abandonment Rate | Reveals checkout friction and purchasing obstacles hurting revenue | WP Rocket, Google Analytics 4, WooCommerce Analytics, Stripe, PayPal |
| Time on Page / Engagement Time | Reveals content quality, readability, and engagement levels | Google Analytics 4, Hotjar |
| Loading Time | Reveals performance issues that increase bounce rates and reduce conversions | WP Rocket, GTmetrix, RocketCDN |
| Google PageSpeed Insights Score | Reveals technical performance issues impacting UX and engagement | PageSpeed Insights, WP Rocket |
| Core Web Vitals | Reveals loading, stability, and interactivity issues affecting UX, SEO, and conversions | WP Rocket, PageSpeed Insights, GTmetrix, Imagify |
Top Coversion Rate Optimization Metrics for Your Business
The right website conversion metrics depend on your goals, your audience, and the type of actions you want visitors to take.
For example, an ecommerce store should focus on checkout behavior and page speed, while a SaaS business may care more about signup completion and onboarding experience.
For eCommerce Websites
Ecommerce websites should focus on metrics directly tied to the purchasing journey and checkout experience.
Most important KPIs:
- Conversion Rate.
- Add-to-Cart Rate.
- Cart Abandonment Rate.
- Exit Rate.
- Loading Time.
- Core Web Vitals.
📝 Why These Metrics Matter
Online shoppers expect a fast and frictionless experience. If product pages load slowly or checkout feels complicated, users leave quickly.
📌 Example
A WooCommerce store notices a high cart abandonment rate on mobile devices. After checking Core Web Vitals and loading time metrics, the owner realizes the checkout page takes more than 5 seconds to load because of heavy scripts and unoptimized images. After optimizing performance with WP Rocket and Imagify, checkout abandonment decreases and conversions improve.
For Lead Generation Websites
Lead generation websites should focus on metrics directly related to form submissions and landing page performance.
Most important KPIs:
- Conversion Rate.
- Bounce Rate.
- Click-Through Rate (CTR).
- Exit Rate.
- Loading Time.
📝 Why These Metrics Matter
Lead generation websites rely heavily on landing pages and calls to action. If users leave too quickly or never click the CTA, conversion opportunities are lost immediately.
📌 Example
A marketing agency notices that users visit their service page but rarely complete the contact form. Heatmaps reveal visitors stop scrolling before reaching the CTA because the page loads slowly on mobile and feels too text-heavy. After improving page speed and redesigning the layout, form submissions increase significantly.
For SaaS and Subscription Businesses
SaaS businesses should focus on signup flow performance, onboarding experience, and engagement metrics.
Most important KPIs:
- Conversion Rate.
- Click-Through Rate (CTR).
- Exit Rate.
- Core Web Vitals.
- Loading Time.
📝 Why These Metrics Matter
SaaS users often compare multiple tools before subscribing. Slow dashboards, confusing onboarding flows, or weak CTAs can negatively impact free trial signups and product adoption.
📌 Example
A SaaS company notices users abandoning the free trial signup page before completing registration. After reviewing exit rate and loading time metrics, the team discovers that a slow-loading pricing comparison table creates frustration on mobile devices. Optimizing performance improves signup completion rates.
For Content Websites and Blogs
Blogs and media websites should focus on engagement, readability, and SEO-related performance metrics.
Most important KPIs:
- Bounce Rate.
- Time on Page.
- Click-Through Rate (CTR).
- Loading Time.
- Core Web Vitals.
- Google PageSpeed Insights Score.
📝 Why These Metrics Matter
Content websites rely heavily on engagement, SEO visibility, and ad revenue. Slow-loading articles and poor mobile experiences often increase bounce rates and reduce session duration.
📌 Example
A publisher notices that users leave blog posts after only a few seconds. After checking loading time and Core Web Vitals, they discover large unoptimized images are slowing down mobile pages. Compressing images with Imagify and enabling caching with WP Rocket significantly improves engagement time.
For Service-Based Businesses
Service businesses should focus on trust, user engagement, and lead generation metrics.
Most important KPIs:
- Conversion Rate.
- Bounce Rate.
- Exit Rate.
- Loading Time.
- Core Web Vitals.
📝 Why These Metrics Matter
Potential clients often evaluate credibility before contacting a service provider. Slow pages, poor UX, or confusing navigation can reduce trust and prevent inquiries.
📌 Example
A law firm notices that visitors frequently leave the “Book a Consultation” page without submitting the form. Performance analysis reveals slow loading times caused by oversized images and multiple third-party scripts. After optimizing the page, the firm sees more consultation requests and improved engagement.
The Best CRO Setup Based on Your Goals
The best conversion rate optimization metrics to track depend on your role, your website goals, and the type of conversions you want to improve. Some users need to focus on engagement and UX, while others should prioritize revenue, checkout performance, or technical optimization.
Below, you’ll find the best website conversion metrics to focus on based on your profile, so you can stop tracking unnecessary data and concentrate on the KPIs that truly impact conversions and business growth.
For Beginners
If you’re new to CRO, start with the basics. These metrics quickly help you understand whether visitors are engaging with your site or leaving because of UX or performance issues. Improving page speed and reducing bounce rates are often the fastest ways to improve conversions with a faster website.
Focus on:
- Conversion Rate.
- Bounce Rate.
- Loading Time.
For Web Designers
As a designer, you know how much design directly impacts usability and conversion behavior. Tracking CTR and engagement metrics helps you understand whether users interact with your layouts, while Core Web Vitals and page speed reveal whether performance issues hurt the overall experience.
Focus on:
- Click-Through Rate (CTR).
- Engagement Time.
- Bounce Rate.
- Core Web Vitals.
For Business Owners
If you are a business owners, you should prioritize metrics tied directly to revenue and customer behavior. These KPIs reveal whether users convert successfully, where they leave the journey, and what friction points may be impacting sales or lead generation.
Focus on:
- Conversion Rate.
- Bounce Rate.
- Exit Rate.
- Cart Abandonment Rate.
For WooCommerce Owners
If you are a Woocommerce store owner, speed and checkout experience are critical. Slow product pages, complicated checkout flows, or poor mobile performance can dramatically reduce conversions. Tracking these metrics helps reduce friction and increase online sales.
Focus on:
- Add-to-Cart Rate.
- Cart Abandonment Rate.
- Conversion Rate.
- Loading Time.
- Core Web Vitals.
For Developers
As a developer, you should focus on technical performance metrics that directly impact UX and conversions. Monitoring Core Web Vitals, script execution, page weight, and loading speed helps identify bottlenecks affecting engagement and SEO visibility.
Focus on:
- Core Web Vitals.
- Loading Time.
- Google PageSpeed Insights Score.
- Exit Rate.
For Freelancers
If you are a freelancer, you often need to demonstrate measurable results to clients. These metrics help showcase improvements in user engagement, lead generation, and overall website performance.
Focus on:
- Conversion Rate.
- Form Conversion Rate.
- Engagement Time.
- Bounce Rate.
For SEOs and Marketers
As an SEO and marketing professional, you should monitor both behavioral and performance metrics. CTR and engagement data reveal campaign effectiveness, while Core Web Vitals and page speed help improve rankings, UX, and landing page conversions.
Focus on:
- Click-Through Rate (CTR).
- Bounce Rate.
- Engagement Time.
- Conversion Rate.
- Core Web Vitals.
For Agencies
If you run a marketing or SEO agency, you need scalable metrics that work across multiple websites and industries. Combining conversion data, performance metrics, and user behavior insights helps prioritize optimizations and deliver measurable results to clients.
Focus on:
- Conversion Rate.
- Core Web Vitals.
- Loading Time.
- Bounce Rate.
- Exit Rate.
CRO Cheat Sheet Based on Your Goals
To make things easier, the table below summarizes the best website conversion metrics to prioritize based on your goal, the biggest risks affecting conversions, and the most relevant CRO tools to help you optimize performance, UX, and user behavior.
| You are… | Main Goal | Priority CRO Metrics | Main Risk | Recommended Tools |
| Beginners | Understand user behavior and improve conversions | Conversion Rate, Bounce Rate, Loading Time | Tracking too many metrics too early | WP Rocket, Hotjar, Google Analytics |
| Web Designers | Create engaging and conversion-focused experiences | CTR, Engagement Time, Bounce Rate, Core Web Vitals | Poor UX and slow-loading layouts hurting usability | Hotjar, Fomo, WP Rocket |
| Business Owners | Increase leads, sales, and trust | Conversion Rate, Exit Rate, Cart Abandonment Rate | Losing revenue because of friction and lack of trust | WP Rocket, Reviews Feed Pro |
| WooCommerce Owners | Reduce checkout friction and increase sales | Add-to-Cart Rate, Cart Abandonment Rate, Loading Time, Core Web Vitals | Slow checkout and poor payment experience reducing purchases | WP Rocket, CartFlows, WooCommerce Stripe Payment Gateway, WooCommerce PayPal Payments, Imagify |
| Developers | Identify technical bottlenecks affecting UX and conversions | Core Web Vitals, Loading Time, PSI Score | Heavy scripts, page weight, and poor performance | WP Rocket, Google Analytics, Contentsquare |
| Freelancers | Demonstrate measurable client results | Conversion Rate, Form Conversion Rate, Engagement Metrics | Difficulty proving ROI and optimization impact | Google Analytics, Hotjar, WP Rocket |
| SEOs & Marketers | Improve campaign performance and landing page conversions | CTR, Bounce Rate, Conversion Rate, Core Web Vitals | Slow and badly designed landing pages hurting SEO and UX | WP Rocket, Google Analytics, Cart Flows, Hotjar |
| Agencies | Scale optimization strategies across multiple websites | Conversion Rate, Loading Time, Exit Rate, Core Web Vitals | Managing performance and UX issues across many client sites | WP Rocket, Contentsquare, CartFlows, Google Analytics |
| 💡 Hint: Did you notice how often page speed and Core Web Vitals appear across all profiles? That’s because website performance plays a major role in user experience and directly impacts many key conversion rate optimization metrics. |
Let’s move on to the next section to better understand how page speed affects conversion rate.
The Hidden Factor: How Website Speed Affects Conversions
Website performance is often underestimated in CRO strategies, yet it has a direct impact on conversions and revenue. A slow-loading page can increase frustration, reduce engagement, and hurt trust on slow mobile devices, where users have far less patience.
A study from Portent shows two key things when it comes to understanding how page speed affects conversion rate:
📊 Faster websites convert significantly better. Websites loading in 1 second convert up to 3x more than websites loading in 5 seconds.
📊 Conversion rates drop dramatically as load time increases: pages loading in 2.4 seconds convert at 1.9%, while pages loading in 5.7 seconds convert at only 0.6%.
You have powerful conversion rate optimization tools available to improve performance and user experience and among them, you’ll find WP Rocket.
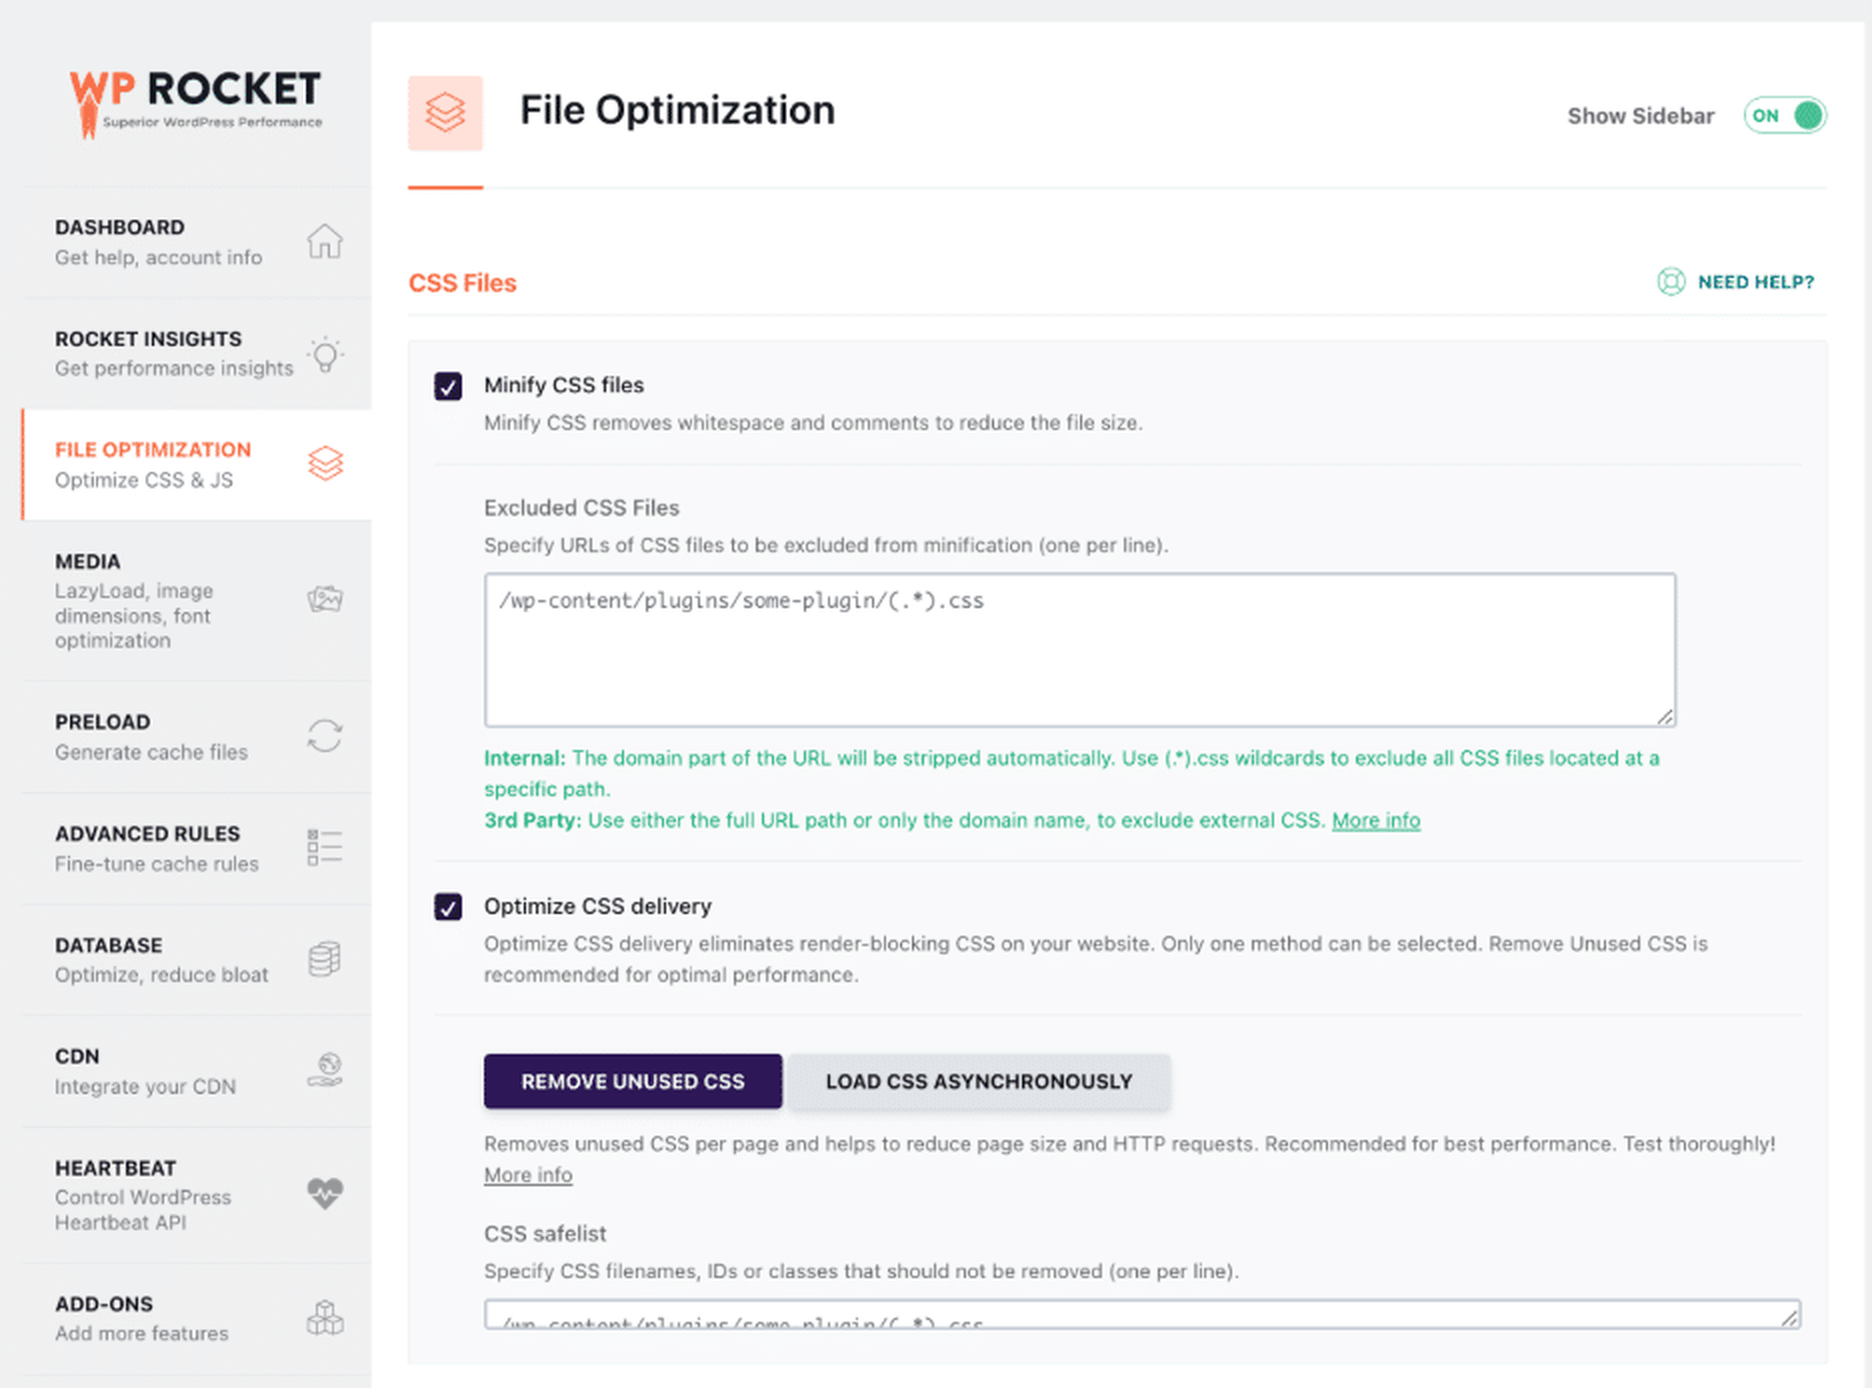
WP Rocket is the easiest and most powerful WordPress performance plugins to improve speed and Core Web Vitals, which help increase conversions. Around 80% of performance best practices are automatically applied upon activation, including caching, GZIP compression, CSS and JavaScript minification, lazy rendering, and many other optimization techniques.
You can go even further with one-click performance features such as delaying and deferring JavaScript execution, removing unused CSS, lazy loading among others.
WP Rocket comes with Rocket Insights, an integrated performance hub that shows your global performance score and four advanced performance indicators (LCP, CLS, TBT, and TTFB) at both site-wide and page levels, along with actionable recommendations tied directly to WP Rocket features.
Rocket Insights helps you monitor website performance more efficiently, optimize speed, and create a better user experience that supports higher conversions.
🚀 To summarize, here’s how WP Rocket can help you support your marketing efforts to improve conversions:
- Improve page speed and loading time.
- Optimize Core Web Vitals more easily.
- Boost your Google PageSpeed Insights score.
- Reduce friction and improve user experience.
- Keep visitors engaged for longer.
- Track performance thanks to Rocket Insights.
- Create a faster website that supports higher conversions and sales.
FAQs
What Is the Most Important CRO Metric?
Conversion rate is the most important CRO metric because it shows how effectively visitors become customers or leads. Website speed also matters since slow pages increase bounce rates and hurt Core Web Vitals. WP Rocket helps improve performance, UX, SEO, and conversions.
How Do You Measure Conversion Rate?
Use tools like Google Analytics 4 or WooCommerce Analytics. Formula: (Conversions ÷ Total Visitors) × 100. For example, 50 purchases from 1,000 visitors equals a 5% conversion rate. Faster websites with WP Rocket can also help improve conversion rates.
How Can I Measure CRO Success and Which Metrics Should I Track?
Track conversion rate, bounce rate, cart abandonment, session duration, and click-through rate in GA4. Monitor page speed and Core Web Vitals with GTmetrix and Rocket Insights.
Which Metrics Improve Conversions the Most?
Conversion rate, cart abandonment rate, page load time, and Core Web Vitals strongly impact conversions. Better website speed improves UX, engagement, and SEO visibility. WP Rocket helps optimize performance and create a smoother conversion journey.
How Does Page Speed Affect Conversion Rate?
Page speed directly impacts UX, SEO, and conversions. Faster websites reduce bounce rates and improve trust, especially on mobile. WP Rocket helps improve Core Web Vitals, loading times, and PageSpeed scores to support better conversion rates.
What Tools Track CRO Metrics?
Popular CRO tools include Google Analytics 4 for conversion tracking, GTmetrix for speed analysis, Hotjar and Contentsquare for behavior insights, and WooCommerce Analytics for ecommerce reporting. WP Rocket supports performance optimization.
How Do I Improve My Conversion Rate Quickly?
Improve website speed, simplify checkout, and reduce friction in the user journey. WP Rocket can quickly improve performance and Core Web Vitals. For ecommerce sites, reducing cart abandonment also helps increase conversions fast.
Are CRO Metrics the Same for Every Website?
Core metrics like conversion rate, loading time, and Core Web Vitals matter for almost every website. However, CRO KPIs vary by goals. Ecommerce stores focus on cart abandonment, while marketers often track signups and CTR. WP Rocket helps improve performance for all website types.
Wrapping Up
Tracking the right conversion rate optimization metrics helps you better understand user behavior, identify friction points, and improve the overall customer journey. One thing clearly stands out across all profiles and business types: page speed and performance play a crucial role in conversions. Faster websites create a better user experience, improve engagement, reduce bounce rates, and support better Core Web Vitals and SEO visibility.
🚀 The easiest way to improve performance on WordPress and to boost Core Web Vitals is to use WP Rocket. The plugin automatically applies around 80% of web performance best practices upon activation, helping you optimize speed and create a better UX that supports higher conversions.
Want to see the impact on your own website? Try WP Rocket with a 14-day money-back guarantee completely risk-free. Remember, better performance leads to better user experience, and better UX leads to more conversions!