
Table of Contents
Last update on
Is your website fast? You probably want to say yes, but the only way to be sure is to test it using one of the best website performance monitoring tools.
Speed, user experience, and reliability must be part of your website strategy from day one. A fast website ranks better on Google, keeps users engaged, and converts more visitors. When a site feels slow or laggy, you leave. When it feels fast, you browse longer, you trust the brand, and you are more likely to take action. Do you agree?
This is where Core Web Vitals monitoring tools and website speed monitoring tools become essential. Core Web Vitals help you understand how Google evaluates real user experience, and keeping these metrics in the green matters. Pages with poor or unstable scores are more likely to lose visibility in search results, while consistently good scores support both rankings and user satisfaction.
Performance is not a one-time measurement. It changes as you add content, update plugins, or modify your design. Ongoing monitoring helps you detect issues early using tools like Rocket Insights or GTmetrix, before they impact SEO or user experience.
Monitoring tools help you identify problems, and optimization tools like WP Rocket help you fix them! Let’s take a look at the best website performance monitoring tools available on the market.
Key Takeaways
✅ Track the right KPIs regularly: Core Web Vitals, fully loaded time, page size, HTTP requests, and server response time are essential indicators of real performance.
✅ Use both synthetic and real user data: Lab tests help you debug issues, while field data validates how real visitors experience your site.
✅ Choose tools based on your needs: Some of them focus on deep diagnostics, others on UX, uptime, or quick speed checks across devices and locations.
✅ Use tools like GTmetrix or Rocket Insights, if you’re a WP Rocket customer, to detect performance issues and get insights on how to fix them.
✅ WP Rocket is the easiest and most powerful way to improve speed and apply the web performance optimizations detected by the monitoring tools.
✅ Example of an easy and fast optimization: Run a GTmetrix test, activate WP Rocket, re-test, and track the gains. Simple, measurable, and effective.
What Is Website Performance Monitoring?
Website performance monitoring means regularly monitoring the speed and overall performance of your WordPress site. The goal is to know when everything is running smoothly and spot issues early when performance starts to drop, so you can take action before users or Google notice it.
Performance monitoring is not just about checking numbers once and moving on. It’s about understanding when your metrics are healthy and when they’re not, and knowing what to fix when something goes wrong. That’s why it’s important to learn a few key concepts before jumping straight into the tools.
Why Websites Slow Down Over Time
Even if your site is fast today, there’s no guarantee it will stay that way. Websites naturally slow down over time, which is why ongoing performance monitoring is essential. Here are some real-life reasons why this happens:
- Your WordPress site runs on an outdated PHP version, or your theme and plugins haven’t been updated in a while.
- You add more content over time, such as blog posts, images, videos, or new products on a WooCommerce store.
- Images and videos are uploaded without proper optimization and served at unnecessarily large sizes.
- Traffic is increasing, but your hosting plan isn’t scaled to match, resulting in server slowdowns.
- Third-party scripts accumulate, like analytics tools, ads, chat widgets, or marketing pixels.
- Small design changes add up, animations, sliders, custom fonts, or heavier layouts slowly impact performance.
Synthetic vs Real User Monitoring
When testing website performance, metrics fall into two main categories: lab (synthetic) data and field (real user) data. Both are useful, but they serve different purposes and should be used together.
- Synthetic Testing (lab data): Synthetic testing measures performance in a controlled environment. For example, they load your page using predefined conditions, devices, and network speeds. For example, you run a test on your homepage and get a score based on a simulated mobile connection. This is ideal for debugging and testing changes before going live.
- Real User Monitoring (RUM or field data): Real User Monitoring collects data from actual visitors using real devices, browsers, and network conditions. It shows how real users experience your site over time. This reflects real-world performance, not simulations.
| 💡 Hint: Lab data shows how your site may perform under controlled conditions, while field data shows how it actually performs for real users. Lab data helps you find and fix issues, while field data helps you validate your performance improvements in the real world. |
Field vs Lab Data Comparison Table
Here’s a quick visual summary of synthetic vs real user monitoring to help you understand the differences at a glance and choose the right performance monitoring tool in the next section.
| Lab (Synthetic) Data | Field (Real User) Data |
| Simulated tests run under controlled conditions (device, location, network). | Real data collected from actual users, for example, via the Chrome User Experience Report (CrUX). |
| Ideal for debugging and diagnosing specific performance issues. | Reflects real-world user experience at scale. |
| It offers full control over test scenarios. | Shows how your site truly performs for real visitors. |
| May not reflect real user behavior perfectly. | Best representation of what users actually experience. |
| Typical metrics: FCP, LCP, TBT, CLS, TTI, TTFB. | Typical metrics: FCP, LCP, INP, CLS, TTFB. |
Performance Metrics You Should Monitor
Knowing which website performance monitoring tools to use is important, but understanding what to look at inside those tools matters just as much. These are the key KPIs you should track regularly.
- Overall performance score (out of 100): Focus on mobile scores first. If your site performs well on mobile, desktop performance is usually solid too.
- Fully loaded time: This indicates how long the entire page takes to load. It’s a good indicator of perceived speed.
- Page weight: The total size of your page. Heavy pages load more slowly, especially on mobile networks.
- Number of HTTP requests: More requests mean more files to load. Reducing them often leads to faster pages.
- Core Web Vitals: These metrics measure real user experience and impact your ranking.
- Largest Contentful Paint (LCP) shows how quickly the main content appears.
- Interaction to Next Paint (INP) measures how quickly the page responds after a user interaction, such as a click or tap.
- Cumulative Layout Shift (CLS) evaluates visual stability.
- Time to First Byte (TTFB): This measures how quickly your server responds to a request. A slow TTFB often points to hosting or backend issues.
Let’s now take a look at a selection of the best website performance monitoring tools to help you test speed, analyze Core Web Vitals, identify bottlenecks, and track performance over time.
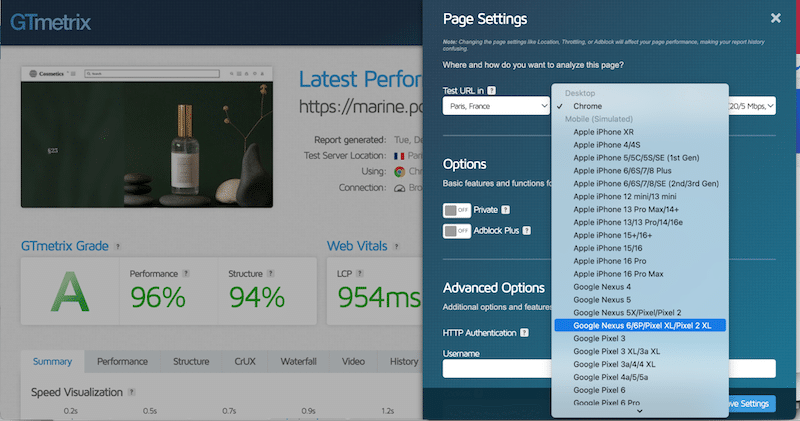
1. GTmetrix
Type: Synthetic (lab data) and field data (generated using Google’s CrUX API)
Overview
GTmetrix is a website performance analysis tool powered by Lighthouse. It runs speed tests and provides detailed diagnostics, KPI grades, and waterfall charts.
Key Features
- Lighthouse-based performance reports
- Core Web Vitals lab metrics
- Waterfall and request breakdown
- Historical performance tracking
Pros
- Very detailed diagnostics
- Excellent for identifying bottlenecks thanks to the waterfall chart
- Easy to compare before-and-after changes and revisit past reports
- Ability to set up alerts, such as email notifications if load time exceeds a threshold or if Core Web Vitals degrade
Cons
- Advanced features require a paid plan
Best For
Developers and marketers willing to debug performance issues and tracking regressions over time.
Pricing
Free plan available. Paid plans start at around $14.95/month and unlock advanced settings, including test locations and network simulation (4G and throttling).
2. Rocket Insights
Type: Synthetic (lab data)
Overview
Rocket Insights is WP Rocket’s built-in performance hub, powered by GTmetrix. It helps you track your key pages, check your performance score and Core Web Vitals, understand what’s affecting your results, and get clear recommendations on which WP Rocket features to enable, all directly from your WordPress dashboard. It focuses on actionable insights with a simple global score and a beginner-friendly approach.
Key Features
- Global performance score based on the pages you track
- Mobile performance testing with detailed reports and key metrics such as load time, requests, page weight, and Core Web Vitals
- Performance indicators available at both global and page level
- Recommendations tied to WP Rocket features to guide optimization
- Re-testing and monitoring to track improvements over time
Pros
- Mobile-focused by default
- Easy-to-understand reports directly inside WordPress
- No need to switch between tools
- Clear guidance on what to optimize next
Cons
- Requires an active WP Rocket subscription
Best For
Non-technical users wanting to monitor site speed directly inside WordPress, with quick performance checks and without juggling multiple tools.
Pricing
Included in all WP Rocket licenses at no extra cost.
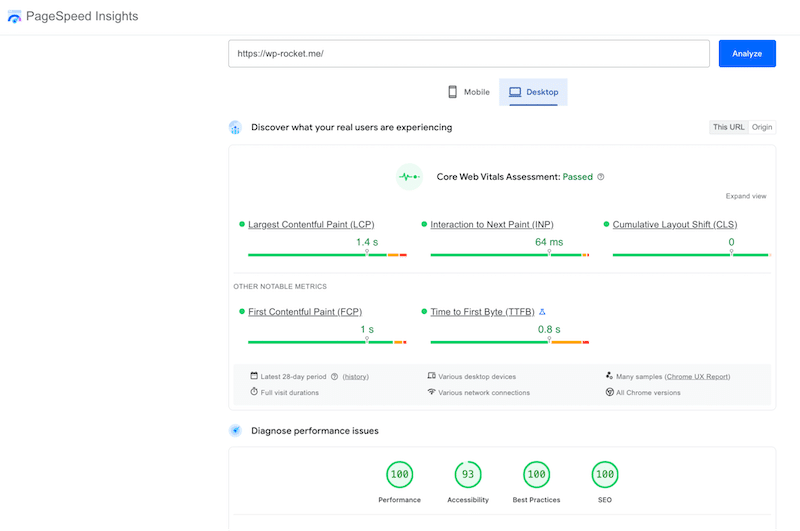
3. PageSpeed Insights
Type: Synthetic and RUM (real user data)
Overview
Google PageSpeed Insights combines Lighthouse lab data with real user field data from the Chrome User Experience Report.
Key Features
- Lab and field Core Web Vitals
- Mobile and desktop testing
Pros
- Uses real Google data
- Free and widely trusted
Cons
- Limited customization (no location or connection simulation)
- Fewer performance KPIs, such as page weight or request count
- Field data may be unavailable for new or low-traffic sites
- No monitoring or history tracking
Best For
Users who are looking for a free, SEO-focused performance analysis tool.
Pricing
Free.
4. Pingdom
Type: RUM
Overview
Pingdom is a website monitoring tool focused on load time, uptime, and availability. It offers reliable performance and uptime tracking using more than 70 global polling locations.

Key Features
- Speed tests from multiple locations
- Performance grading
- Uptime monitoring
- Alerts and reporting
- Content size and request breakdown by type
Pros
- Very easy to use
- Helps identify which files slow down the site
- Clear, shareable reports
- Reliable uptime monitoring
Cons
- Limited optimization guidance
- Not Core Web Vitals–focused
- No mobile versus desktop testing
Best For
Quick speed checks, uptime monitoring, and users not focused on Core Web Vitals.
Pricing
Free speed tests are available, but the monitoring plans are premium.
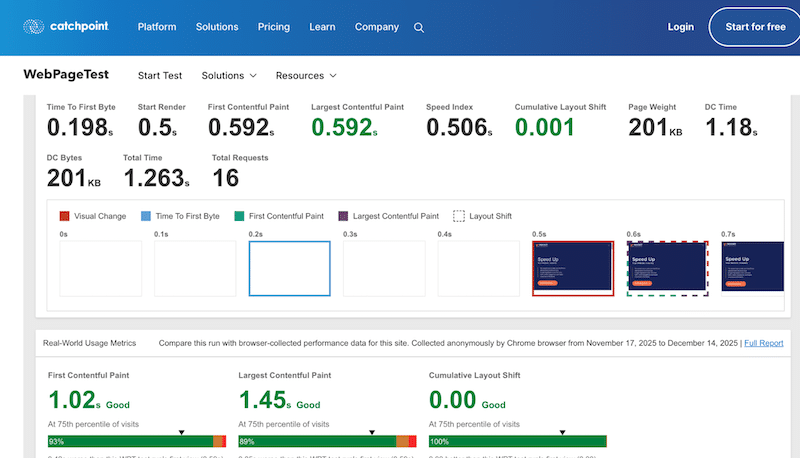
5. WebPageTest
Type: Synthetic (lab data) and RUM
Overview
WebPageTest is a powerful performance testing tool that provides in-depth diagnostics across browsers, devices, and network conditions. Originally open-sourced in 2008, it is now part of Catchpoint’s enterprise monitoring platform.
Key Features
- Network simulation (4G, WiFi)
- Testing from the US, Europe, and Asia
- In-depth Core Web Vitals, Lighthouse scores, and custom metrics
Pros
- Combines lab data and real user monitoring
- Strong diagnostic capabilities
- Clean interface
Cons
- Steeper learning curve
- Advanced features require a paid plan
Best For
Developers and teams that are learning performance fundamentals and running deep audits.
Pricing
Free basic usage with paid plans for advanced features.
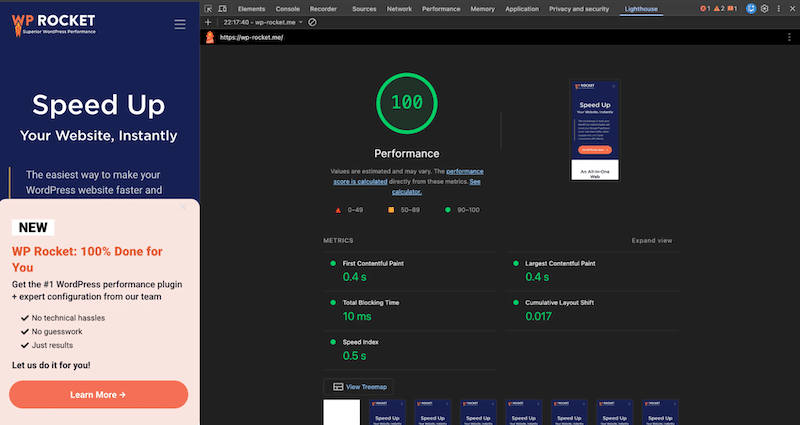
6. Chrome DevTools
Type: Synthetic (lab data)
Overview
Lighthouse is an open-source auditing tool built into Chrome that evaluates performance, SEO, accessibility, and best practices.
Key Features
- Performance and Core Web Vitals audits
- SEO and accessibility checks
- Runs locally in Chrome DevTools
Pros
- Free and reliable (based on Lighthouse)
- Ideal during development
- Easy to run directly from Chrome
Cons
- No real user data
- Requires technical knowledge
Best For
Developers optimizing websites before launching or users running quick performance checks.
Pricing
Free.
7. Contentsquare
Type: RUM (Real User Monitoring)
Overview
Contentsquare is a digital experience analytics platform that connects performance data with real user behavior across the entire customer journey.
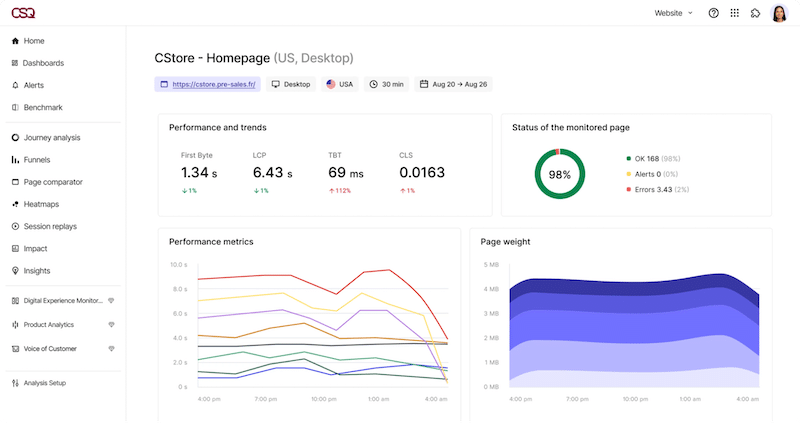
Key Features
- Real user monitoring and Core Web Vitals
- Heatmaps and session replay
- Conversion and journey analysis
- UX performance insights
Pros
- Strong UX and business insights
- Real-world data
- Enterprise-grade analytics
Cons
- Not a pure speed testing tool
- Expensive for small websites
Best For
Large websites focused on UX, CRO, and full conversion funnel analysis rather than raw page speed alone.
Pricing
Custom enterprise pricing.
8. BrowserStack
Type: Real device testing (not performance metrics)
Overview
BrowserStack is a real-device testing platform that helps teams identify UX and compatibility issues across browsers and devices.
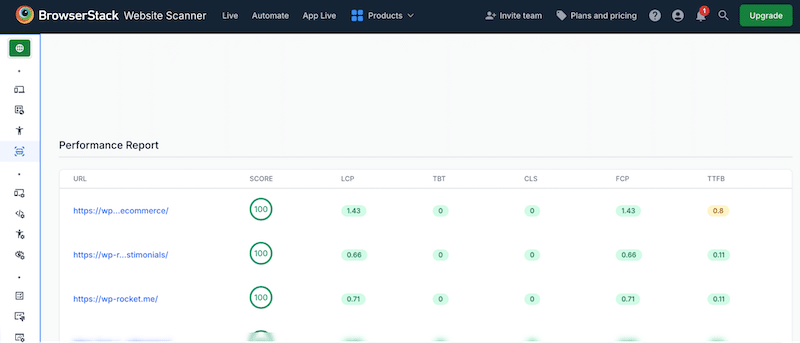
Key Features
- Real device and browser testing
- Mobile and desktop coverage
- Debugging tools
- Visual testing
Pros
- True real-world environments
- Excellent for QA and UX testing
- Highly reliable
Cons
- Not a performance monitoring tool
- No Core Web Vitals tracking
Best For
QA teams and agencies that are testing real-device behavior and cross-browser compatibility.
Pricing
Paid plans only, pricing varies by usage.
Website Performance Analysis Tools Comparison
Both table compares the most popular website performance analysis tools based on testing methods, Core Web Vitals support, and monitoring capabilities.
Table 1: Testing Environments and KPI
| Tool | Test from Multiple Locations | Core Web Vitals | Fully Loaded Time |
| GTmetrix | Yes | Yes | Yes |
| Rocket Insights | No | Yes | Yes |
| PageSpeed Insights | No | Yes | No |
| Pingdom | Yes | No | Yes |
| WebPageTest | Yes | Yes | Yes |
| Chrome DevTools | No | Yes | No |
| Contentsquare | Yes | Yes | No |
| BrowserStack | Yes | Yes | No |
Table 2: Type of Testing, Monitoring, and Pricing
| Tool | Type | Performance Alerts | Uptime Monitoring | Pricing |
| GTmetrix | Synthetic + RUM | Yes | Yes | Free + Paid |
| Rocket Insights | Synthetic | No | No | Free + Paid |
| PageSpeed Insights | Synthetic + RUM | No | No | Free |
| Pingdom | RUM | Yes | Yes | Free + Paid |
| WebPageTest | Synthetic + RUM | Limited | No | Free + Paid |
| Chrome DevTools | Synthetic | No | No | Free |
| Contentsquare | RUM | Yes | Yes | Enterprise |
| BrowserStack | Real-device testing | No | No | Paid |
How to Monitor and Optimize Website Performance
One of the best website performance analysis tools to monitor Core Web Vitals and overall website performance is GTmetrix. At the same time, one of the easiest ways to optimize page speed is to use a performance plugin like WP Rocket, which helps you improve speed and Core Web Vitals without complex configuration.
Below is a practical, step-by-step approach to analyzing your WordPress site and delivering meaningful performance improvements.
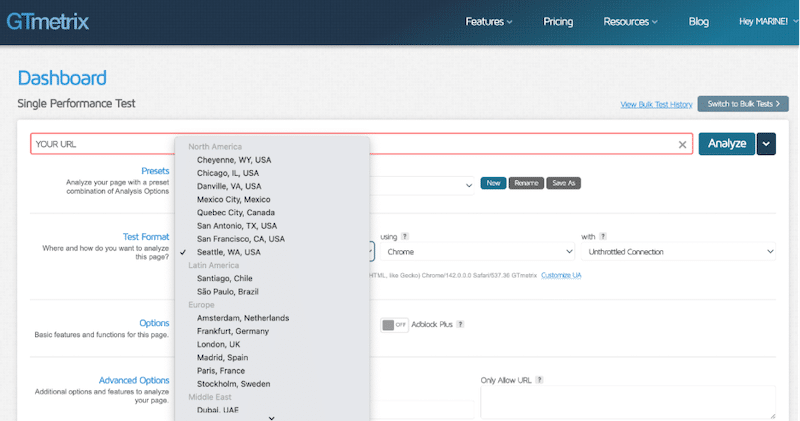
1. Run an Initial Performance Test
Go to GTmetrix and run a test using your website URL, ideally in incognito mode.
Start with a mobile test and select a testing location near your main servers or primary market. For example, if most of your customers are in France, select a testing location in Paris.
2. Analyze and Note Key Performance Metrics
Review the main score and write down the essential KPIs: overall performance score, Core Web Vitals, fully loaded time, total page size, and number of HTTP requests.
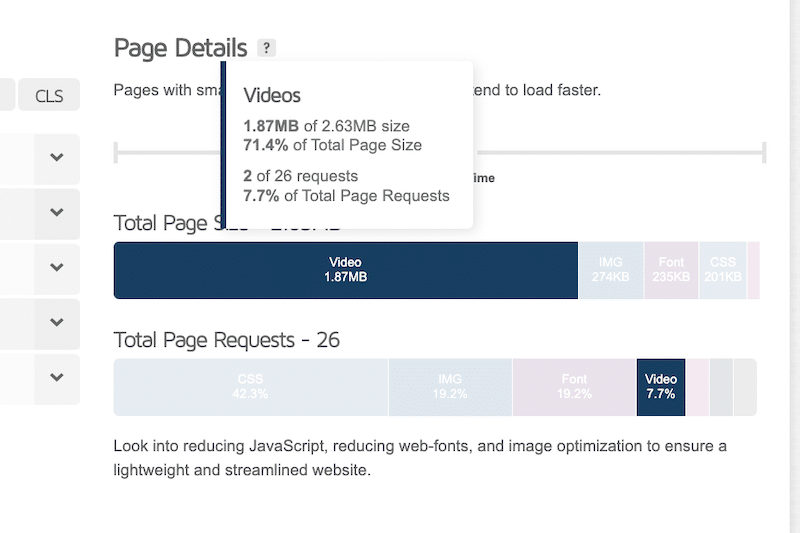
Scroll to the “Page details” section to identify what is weighing your page down.
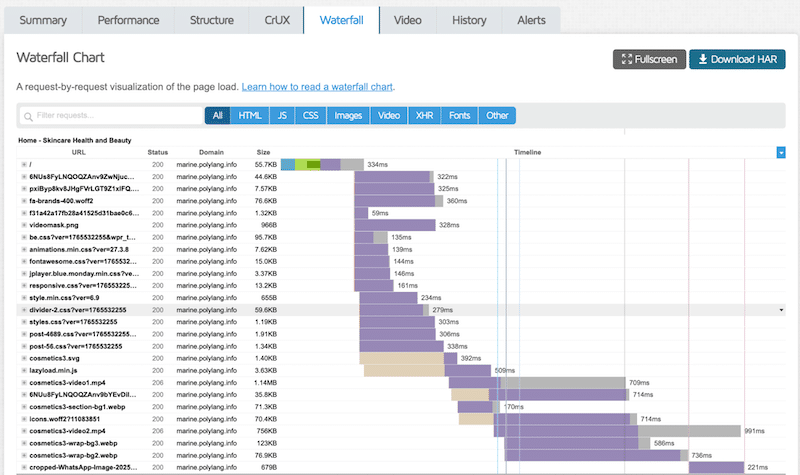
Also, review the waterfall chart. This is where you can clearly identify performance bottlenecks, such as slow server response times, render-blocking resources, or heavy third-party requests.
3. Review the Top Performance Issues
Next, check the “Top Issues” section. GTmetrix highlights what needs attention and ranks recommendations by impact level, such as low, medium, or high.
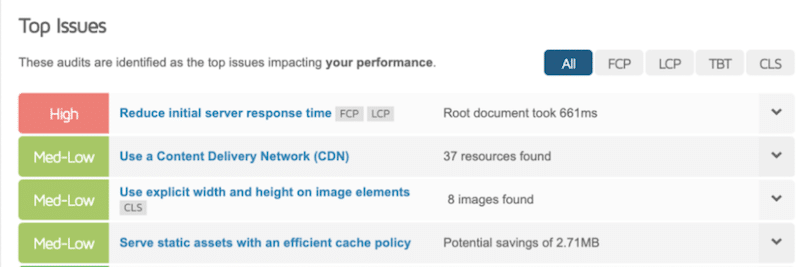
At this stage, you often see recurring issues such as missing cache, unoptimized images, or render-blocking scripts.
| 💡 Hint: GTmetrix provides lab data. If you want real user field data, open the Chrome User Experience Report (CrUX) to see how real visitors experience your site. |
4. Apply Optimizations Using the Right Tools
Most GTmetrix recommendations can be addressed with performance plugins like WP Rocket for caching and code optimization, and Imagify for image compression and optimization. (🚀 Jump to the next section to see WP Rocket in action)
5. Re-run the Test and Compare the Results
Once optimizations are applied, rerun the GTmetrix test. Compare the new results with your initial benchmark to confirm what has been fixed and how performance has improved.

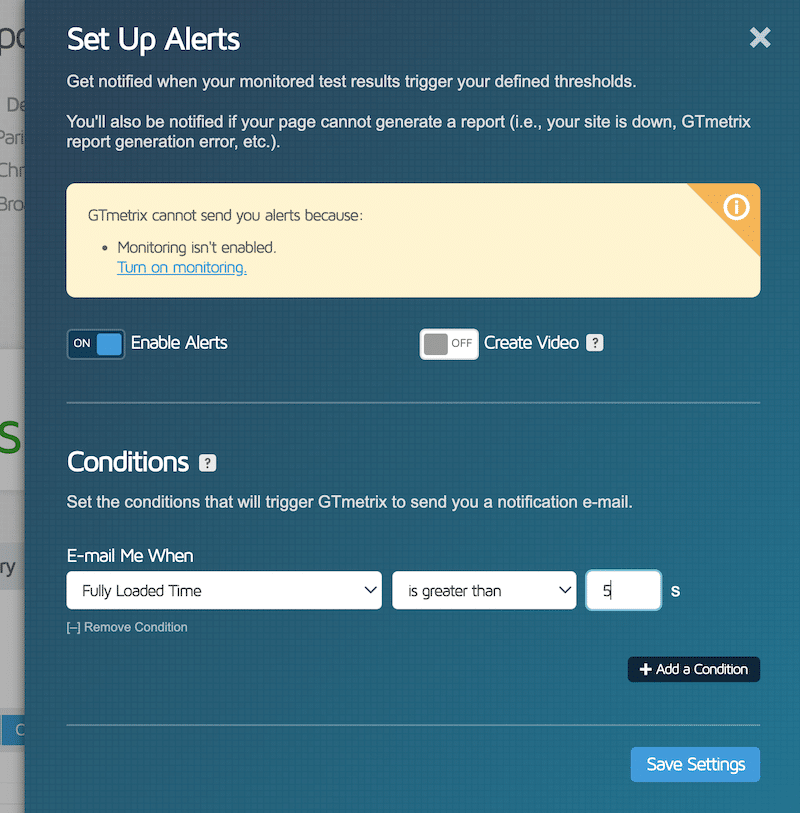
6. Set up Performance Monitoring
GTmetrix allows you to configure monitoring alerts. For example, you can receive an email if the fully loaded time exceeds five seconds or if your Largest Contentful Paint metric degrades beyond a defined threshold.
7. Monitor Performance Regularly
Performance optimization is not a one-time task. Monitor your site weekly to catch regressions early. If you are a WordPress and a WP Rocket user, you can simplify this process with Rocket Insights, powered by GTmetrix, which lets you track key pages directly from your WordPress dashboard.
Now that you know how to run a performance test on a monitoring tool, let’s see a real-life optimization example with WP Rocket.
How WP Rocket Helps Fix Performance Issues
In this article, we don’t just give you the KPIs to track and the best website performance monitoring tools to use. We also show you what to do when those tools flag performance issues, and the easiest way to tackle them is to use WP Rocket!
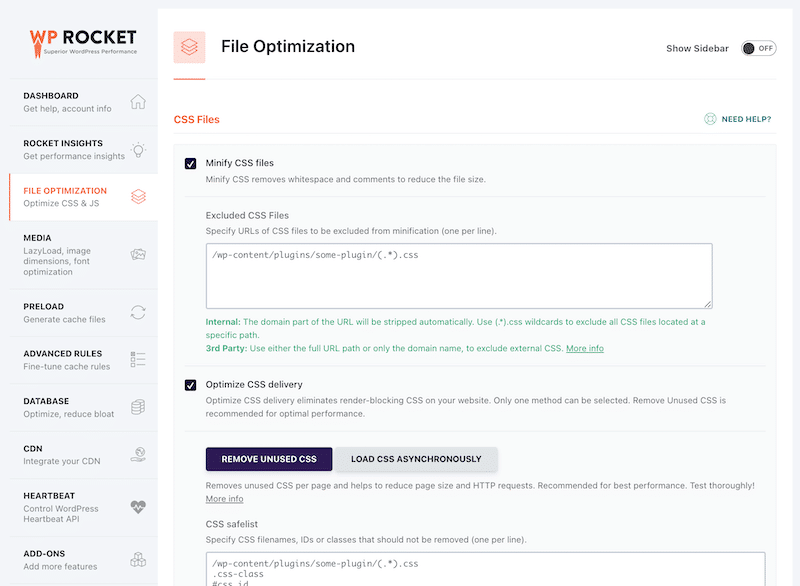
WP Rocket is the easiest and most powerful performance plugin for WordPress. Upon activation, it automatically applies around 80% of web performance best practices, including page caching, GZIP compression, lazy rendering, critical image optimization, and CSS and JavaScript minification.
With just a few clicks, you can go further by enabling advanced features such as deferring JavaScript, delaying JavaScript execution, removing unused CSS, font optimization and preloading, advanced lazy loading options, database optimization, and more.
🚀 Performance monitoring tools flag issues, and WP Rocket fixes them.
When you run a test with website speed monitoring tools like PageSpeed Insights or GTmetrix, the most common issues flagged usually relate to:
- Missing or inefficient caching
- Poor image optimization
- Unoptimized CSS and JavaScript
- Lazy loading is not enabled
- Important resources not preloaded
- Font loading issues
You’ll typically find these warnings in the Diagnostics, Insights, or Top Issues sections of performance reports. These are not random suggestions; they highlight the most critical issues that slow your site down and affect Core Web Vitals.
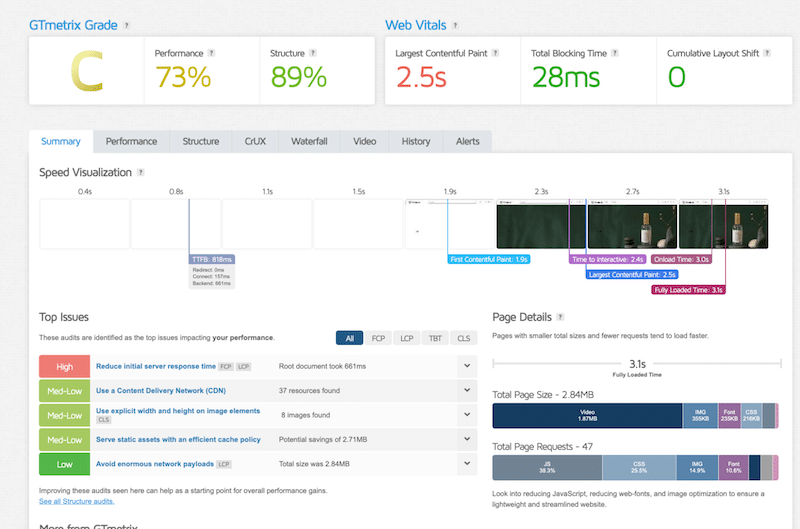
For example, that’s a performance test run on GTmetrix without optimization (no WP Rocket).
Performance test without optimization (no WP Rocket)
Before any performance optimization, this GTmetrix test shows common speed issues:
- Performance grade: C (73%)
- Largest Contentful Paint (LCP): 2.5s (in red, threshold not met)
- Fully loaded time: 3.1s
- Total page size: 2.84 MB
- HTTP requests: 47
- Example of GTmetrix recommendations: reduce server response time, add caching, and use a CDN.
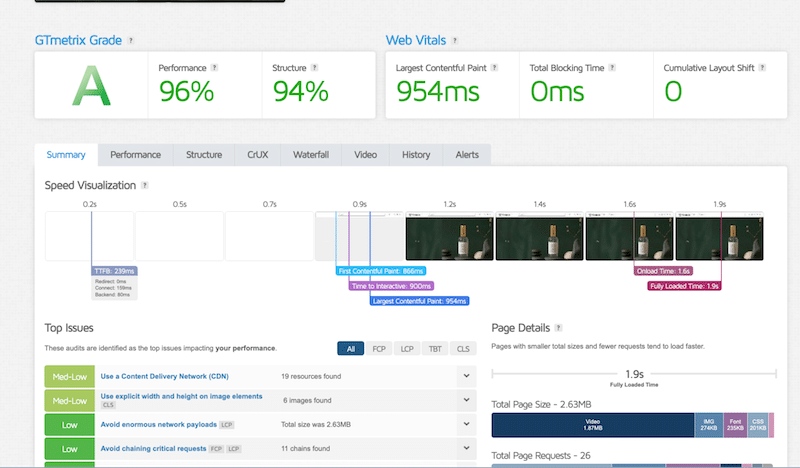
🚀 Performance test after installing WP Rocket
After installing and activating WP Rocket’s features, load times, Core Web Vitals, and overall performance improved significantly:
- Performance grade: A (96%)
- Largest Contentful Paint (LCP): 954 ms (green, Core Web Vitals passed)
- Fully loaded time: 1.9s
- Total page size: 2.63 MB
- HTTP requests: 26
- Key fixes applied: caching enabled, server response time reduced, performance bottlenecks resolved.
FAQs on Website Performance Monitoring
What is website performance monitoring?
Website performance monitoring is the process of regularly checking your site’s speed, stability, and user experience. It helps you detect slow pages, Core Web Vitals issues, and performance regressions before they affect SEO or user experience.
Which metrics matter most for website speed and Core Web Vitals?
The Core Web Vitals metrics to monitor are Largest Contentful Paint (LCP), Interaction to Next Paint (INP), and Cumulative Layout Shift (CLS). You should also track fully loaded time, page size, HTTP requests, and Time to First Byte (TTFB).
What is the difference between synthetic tests and Real User Monitoring?
Synthetic tests simulate page loads under controlled conditions and are ideal for debugging and testing changes. Real User Monitoring uses data from real visitors and shows how your site actually performs in the real world over time.
Which tools are best for monitoring website performance?
Popular website performance monitoring tools include GTmetrix, PageSpeed Insights, Rocket Insights, WebPageTest, and Pingdom. For UX-focused analysis, tools like Contentsquare are useful. The best tool depends on whether you need deep diagnostics, real user data, or quick speed checks.
Do monitoring tools improve website performance?
Monitoring tools do not improve performance on their own. They help you identify problems. To address those issues, you need an optimization plugin such as WP Rocket, the most powerful performance plugin for WordPress.
How often should I monitor my website performance?
You should monitor performance at least once a week and after every major update, such as plugin installations, theme changes, or content updates. Continuous monitoring helps you catch issues early.
How can I fix the issues identified by monitoring tools?
Most performance issues can be resolved through caching, image optimization, and CSS and JavaScript optimization. To apply these fixes easily and without technical knowledge, you can use WP Rocket, the most powerful performance plugin for WordPress. It simplifies optimization by automatically applying 80% of web performance best practices upon activation, helping you quickly and efficiently improve Core Web Vitals.
Wrapping Up
There is no single “best” website performance monitoring tool for everyone. The right choice depends on your needs. Some tools focus on in-depth technical diagnostics; others on real-user behavior and UX; still others are designed for quick speed checks and Core Web Vitals monitoring.
Ask yourself what you need first. Do you want a full performance and UX analysis, or is a simple website speed-testing tool sufficient? Do you need real user data, synthetic tests, or both? Do you want to simulate different networks, devices, or locations? Once you answer these questions, choosing the right tool becomes much easier.
No matter which monitoring tool you use, fixing performance issues efficiently is just as important as detecting them. WP Rocket makes this part simple. It helps you bring Core Web Vitals into the green and push your overall performance score close to 100/100, as shown in the real testing scenario above. It’s powerful and easy to use, with no risk thanks to the 14-day money-back guarantee