
Table of Contents
Last update on
Want to know the best real user monitoring tools to measure performance? Of course, you want to know how your site truly feels for your customers!
Is the checkout smooth or frustrating? Does the page load instantly, or does it make users wait?
Page speed isn’t universal; it varies by device, browser, network, and location. That’s why real user performance monitoring matters if you want measurements based on real-life scenarios.
In this guide, we break down the best real user monitoring software, key best practices, and common mistakes to avoid. You’ll learn what to measure, how RUM tools uncover real-world issues, and how to turn insights into action.
And once you know what to fix? You can implement performance improvements easily with WP Rocket, without touching code.
| TL;DR Real User Monitoring Tools collect real-world performance data from actual visitors. They help you uncover slow pages, UX bottlenecks, and Core Web Vitals issues across devices, browsers, and regions. They’re essential for developers, marketers, and WordPress site owners who want accurate performance insights, not simulated assumptions. RUM tools are the step one toward a healthy, fast website. Step two? Turning those insights into action with WP Rocket, the easiest and most powerful performance plugin to fix the issues flagged by the RUM tools. |
✅ Key Takeaways
- Real user monitoring software shows how your site performs in real-world conditions, not controlled lab tests.
- Segmenting data by mobile, geography, and browser reveals hidden performance gaps.
- RUM tools help connect technical metrics (LCP, INP, CLS) to real business impact like bounce rate and conversions.
- Don’t just collect data: act on it. Monitoring without optimization doesn’t improve performance.
- Up to 80% of the performance issues flagged by RUM tools can be improved immediately after activating WP Rocket.
What Is Real User Monitoring (RUM)?
Real User Monitoring (RUM) is a performance tracking method that collects real-world performance data from actual visitors to your website. Instead of relying on simulated tests run from a lab environment, RUM tools measure what real people experience when they browse your site.
In simple terms, RUM tools work by adding a small, lightweight JavaScript snippet to your site. It runs in each visitor’s browser and collects real-time data on load speed, interactivity, and errors — showing you exactly how real users experience your website.
| 🛠️ Looking for the full technical workflow? Head to the detailed “How RUM Tools Work” section. |
The example below is a RUM report from DebugBear. It’s like a mix of Google Analytics and Core Web Vitals measurement, combining UX insights with more advanced geographic data. The data overlaps and can be correlated to draw meaningful marketing conclusions.
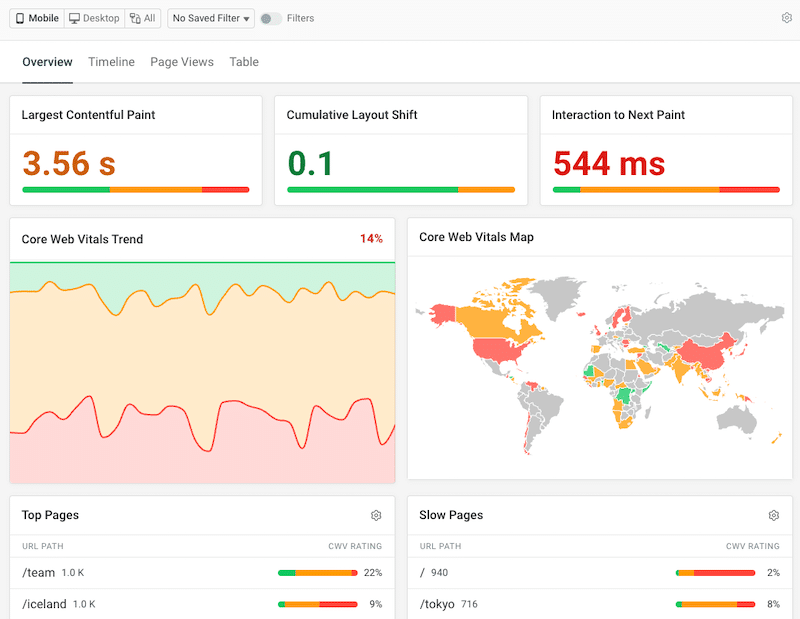
For example, RUM can tell you:
- If your homepage loads quickly on the desktop but feels slow on the mobile.
- Whether users in Australia experience longer load times than users in the US.
- If your checkout page takes too long to become interactive, it may affect conversion rates.
- Whether a recent plugin update caused unexpected JavaScript errors.
| 💡Hint: Real user performance monitoring vs synthetic testing Synthetic tests simulate traffic in controlled environments. RUM shows you reality across different devices, browsers, connection speeds, and geographic locations. |
What Do Real User Monitoring Tools Measure?
User monitoring tools measure how your website performs actual visitors across different countries, connection speeds, browsers, and hardware configurations. That real-world visibility is often the missing link between “great lab scores” and “why are users still bouncing?”
Here’s what RUM tools actually track:
1. Core Web Vitals (Real SEO Impact)
Most real-user monitoring software focuses heavily on Core Web Vitals because they reflect real-world user experience. For example:
- Largest Contentful Paint (LCP) shows whether your hero image loads in 2 seconds on desktop but 4 seconds on mobile.
- Interaction to Next Paint (INP) reveals if users click “Add to Cart” and wait before the page responds.
- Cumulative Layout Shift (CLS) detects when a button jumps while loading, causing accidental clicks.
2. Page Load & Resource Timing
Real user performance monitoring tracks how long each part of your page takes to load. That includes Time to First Byte, full page load time, and resource timing for images or scripts.
For example, you might discover that a third-party chat widget adds 800ms to mobile load time — something a single synthetic test might not clearly expose across real traffic.
3. User Interactions & Engagement
Unlike synthetic testing, RUM tools measure behavior. They track clicks, navigation flows, scroll depth, and session duration. If users consistently abandon your checkout page after a delay, RUM data helps connect performance issues to conversion drops.
For example, a 2-second delay before a payment button on WooCommerce becomes interactive can significantly impact sales, and RUM makes that visible.
4. Errors & Frontend Failures
Advanced real user monitoring tools can even detect JavaScript errors and failed API requests in real time.
Let’s say you update a plugin, and a script breaks only in Safari. Instead of waiting for support tickets, RUM shows you the issue immediately, including which browser and device are affected.
5. Geographic & Device Differences
Performance is rarely consistent across all users. A page might load in 1.8 seconds in the US on a desktop but take 3.5 seconds on a mid-range Android device in South America. Real user monitoring software highlights these differences so you can prioritize optimizations where they matter most.
8 Best Real User Monitoring Tools for Real-World Website Performance
Choosing the best real user monitoring tools depends on your goals. Some real user monitoring software focuses on Core Web Vitals and SEO. Others combine RUM tools with backend observability, session replay, or uptime monitoring.
Below are 8 real user performance monitoring solutions, each suited for different use cases.
1. Chrome User Experience Report (CrUX)
CrUX is Google’s public dataset built from real Chrome users who opted into usage statistics. It reflects how real visitors experience your site across devices and regions and powers tools like GTmetrix.
Perfect if you want official Google field data to benchmark performance and Core Web Vitals without installing real user monitoring software.
Do you need to install anything?
No. CrUX is a public dataset and cannot be customized or configured.
Core Web Vitals monitoring
Yes. Aggregated LCP, INP, and CLS data based on real users.
Monitoring / Alerts
No real-time monitoring, dashboards, or alerting systems. You will need to use GTmetrix to monitor your performance and receive custom alerts.
Free Version
Yes.
2. Pingdom Real User Monitoring
Pingdom combines uptime monitoring, synthetic testing, and real-user monitoring in a single platform. It supports segmentation by device, browser, and country, helping you detect geographic or device-based performance differences.
Perfect if you want uptime monitoring combined with real user performance monitoring.
Do you need to install anything?
Yes. A JavaScript snippet must be added to your site.
Core Web Vitals monitoring
Yes.
Monitoring / Alerts
24/7 monitoring with email and SMS alerts. You can define custom thresholds for performance or uptime degradation.
Free Version
Trial available.
3. DebugBear
DebugBear focuses on advanced Core Web Vitals diagnostics. It allows segmentation by device type, network conditions, and country, and identifies which page elements affect LCP or INP performance.
Perfect if you want deep, real user performance monitoring with actionable Core Web Vitals diagnostics.
Do you need to install anything?
Yes. Add a lightweight JavaScript snippet.
Core Web Vitals monitoring
Yes. Detailed LCP, INP, and CLS tracking.
Monitoring / Alerts
Email and Slack alerts for performance regressions, threshold breaches, and segment-specific drops.
Free Version
Trial available.
4. SpeedCurve
SpeedCurve combines synthetic testing with real user monitoring software and emphasizes long-term performance trend tracking. It allows you to compare releases and track how deployments affect real user experience.
Perfect if you want to track performance trends and compare releases over time.
Do you need to install anything?
Yes. Requires adding a RUM script.
Core Web Vitals monitoring
Yes.
Monitoring / Alerts
Performance budget alerts and email notifications when trends regress or thresholds are exceeded.
Free Version
Trial available.
5. New Relic Browser
New Relic Browser connects real user performance monitoring with backend logs, server metrics, and infrastructure monitoring. It allows correlation between frontend issues and backend performance problems.
Perfect if you need full-stack observability, combining RUM tools with backend monitoring.
Do you need to install anything?
Yes. Requires installing a browser agent.
Core Web Vitals monitoring
Yes.
Monitoring / Alerts
Real-time alerts via email, Slack, and PagerDuty. Alerts can correlate frontend slowdowns with backend errors or infrastructure issues.
Free Version
Limited free tier available.
6. Datadog RUM
Datadog provides enterprise-grade real user monitoring software with session replay capabilities. You can visualize anonymized user sessions and correlate frontend performance with backend traces.
Perfect if you want advanced RUM tools with session replay and infrastructure-level monitoring.
Do you need to install anything?
Yes. Requires adding the Datadog SDK or script.
Core Web Vitals monitoring
Yes.
Monitoring / Alerts
Real-time alerts via email, Slack, and PagerDuty. Supports performance threshold alerts and session replay triggers.
Free Version
Limited free plan available.
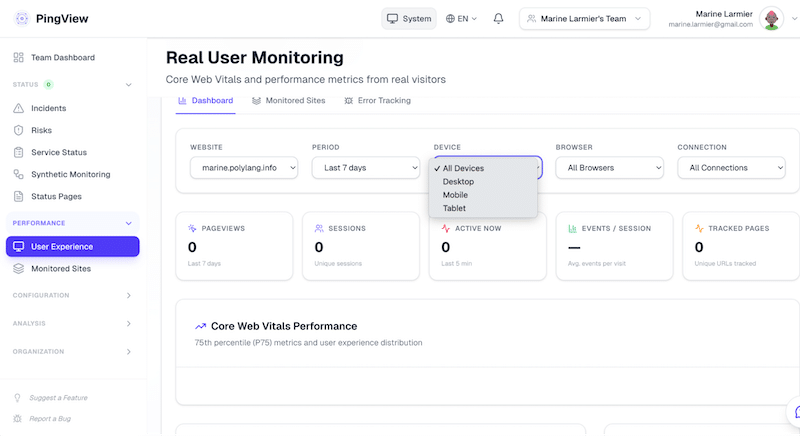
7. PingView RUM
PingView is a lightweight real user monitoring software focused on Core Web Vitals and segmentation. It uses a small script and supports breakdowns by device, browser, and region.
Perfect if you want simple, focused, real user performance monitoring without enterprise complexity.
Do you need to install anything?
Yes. Add a small JavaScript snippet (around 2KB).
Core Web Vitals monitoring
Yes.
Monitoring / Alerts
Email and webhook alerts with device- or browser-specific performance triggers.
Free Version
Trial available.
8. RUMvision
RUMvision specializes in real-time Core Web Vitals monitoring with segmentation by device type, internet speed, and page templates. It supports annotations for deployments to track regressions.
Perfect if your priority is SEO-focused Core Web Vitals monitoring with regression detection.
Do you need to install anything?
Yes. Requires adding a JavaScript snippet.
Core Web Vitals monitoring
Yes.
Monitoring / Alerts
Email alerts when Core Web Vitals fall below thresholds and regression tracking tied to deployments.
Free Version
Trial available.
Real User Monitoring Tools Comparison
Choosing between the best real user monitoring tools depends on whether you need SEO benchmarking, lightweight RUM software, or full real user performance monitoring integrated with backend observability.
Here’s a side-by-side comparison of these real user monitoring tools to help you choose the right real user monitoring software for your WordPress site.
| Tool | Code Snippet Required? | Core Web Vitals | Monitoring / Alerts | Best For |
| CrUX | ✗ | ✓ | ✗ | Getting official Google field data |
| Pingdom | ✓ | ✓ | ✓ Email & SMS alerts | Uptime + RUM tools |
| DebugBear | ✓ | ✓ | ✓ Email & Slack regression alerts | Advanced CWV diagnostics |
| SpeedCurve | ✓ | ✓ | ✓ Performance budget alerts | Trend & release tracking |
| New Relic | ✓ | ✓ | ✓ Email, Slack, PagerDuty alerts | Full-stack real user monitoring |
| Datadog | ✓ | ✓ | ✓ Slack, PagerDuty + session replay alerts | Enterprise RUM software |
| PingView | ✓ | ✓ | ✓ Email & webhook alerts | Lightweight RUM |
| RUMvision | ✓ | ✓ | ✓ Email regression alerts | SEO-focused CWV tracking |
How Real User Monitoring Works
So how do real user monitoring tools actually collect this data?
Most RUM tools work by adding a small JavaScript snippet to your website. This script runs in your visitors’ browsers and quietly collects performance and interaction data as they navigate your pages.
Here’s how the real user monitoring process works, step by step:
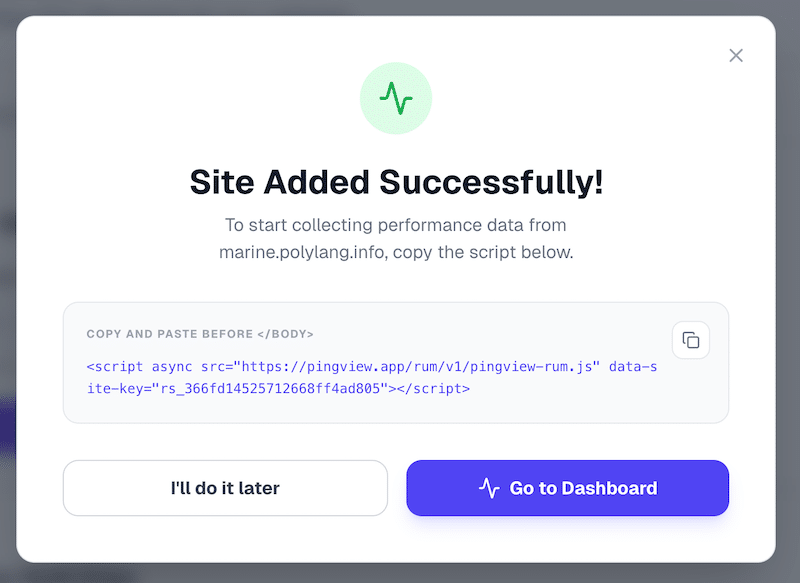
1. Install a Monitoring Snippet on Your Website
Before anything can be tracked, you need to connect your site to the monitoring platform. This is usually done by adding a small analytics snippet (a lightweight JavaScript code) to your website.
In most cases, the snippet is very light and does not impact performance. For example, many RUM tools provide a short script that you can insert into your WordPress header via a plugin or a tag manager. Once installed, your site is officially connected to the real user’s monitoring software.
2. A User Visits Your Website
The process begins the moment a real visitor lands on your site. As the page loads, the RUM script automatically starts collecting performance data from that specific session. It measures how long it takes for visible content to appear, when the page becomes interactive, and whether any elements shift unexpectedly while loading.
For example, if your homepage looks fast on a desktop but feels sluggish on a mid-range Android phone, real user performance monitoring captures that difference. If a visitor clicks a button and experiences a delay before the page responds, that interaction timing is recorded as well.
3. Data Is Sent to the RUM Platform
Once the data is collected, it’s securely sent to the real user monitoring software’s servers for processing. This happens continuously across all real sessions, building a large dataset based on actual traffic rather than simulated tests.
Because RUM tools gather information from many users, they provide statistically meaningful insights. Instead of relying on a single lab result, you see trends across devices, browsers, connection speeds, and geographic regions.
4. The Tool Analyzes Patterns and Detects Issues
After the data is aggregated, the RUM tool analyzes it to identify patterns, anomalies, and potential bottlenecks. This is where insights start to surface.
You might discover that a product page loads slowly only for mobile users, that visitors from a certain country experience higher latency, or that a recent plugin update introduced JavaScript errors in specific browsers. If users consistently abandon a form after a delay, the real user monitoring tool can help you connect performance slowdowns with behavioral drop-offs. Instead of guessing what’s wrong, you can see where and for whom the issue occurs.
5. Results Are Displayed in Dashboards
All findings are presented in dashboards and visual reports that make the data easy to interpret. You can review metrics like page load times, error rates, Core Web Vitals scores, device comparisons, and geographic performance breakdowns.
Some advanced RUM tools even offer session replay, allowing you to watch anonymized user sessions to better understand how performance issues affect real behavior. Many also include real-time monitoring alerts and email notifications, so you’re automatically informed when performance drops, error rates spike, or Core Web Vitals fall below thresholds.
5 Tips to Monitor Real User Performance Correctly
Using real user monitoring tools effectively means going beyond simply checking a dashboard. To get meaningful insights from your real user performance monitoring data, you need structure, segmentation, and context. Let’s go over the best practices you can follow to make sure your performance tests are accurate.
1. Monitor More Than Just Your Homepage
Your homepage might load quickly, but what about your product pages, blog posts, account pages, or checkout flow? Different templates often behave differently. For example, your homepage may load in 1.8 seconds, while your WooCommerce cart page takes 3.5 seconds due to extra scripts. Make sure you monitor multiple page types to identify hidden bottlenecks.
2. Separate Mobile and Desktop Data
Mobile performance is often very different from desktop performance. A page that feels fast on a powerful laptop may feel sluggish on a smartphone using a 4G connection. Always segment your RUM data by device type. And if you want to go even further, don’t just separate mobile and desktop: segment by specific device models. Performance can vary significantly between a high-end iPhone, a mid-range Samsung device, or an older iPad. Real user monitoring software helps you identify these differences so you can optimize for the devices your audience actually uses. You can get device breakdown data from your analytics platform, such as Google Analytics, to better understand how users access your site.
3. Segment by Geography and Browser
Performance varies by region, browser, and also depends on where your origin servers are located. A page that loads quickly in the US may take noticeably longer in Asia due to server distance or network conditions. Likewise, a feature that works perfectly in Chrome may cause issues in Safari. Breaking down performance by country and browser allows you to detect patterns that would otherwise remain invisible for international customers.
4. Combine RUM with Log Management and Infrastructure Monitoring
Real user monitoring tools show what users experience, but not always why it happens. To diagnose the root cause of slowdowns or errors, combine RUM data with backend logs and infrastructure monitoring. A slowdown could come from a slow database query, a basic code error, an overloaded CPU, or a server configuration issue. You should correlate frontend experience with backend data to give you a complete performance picture.
5. Validate Findings on Real Devices and Stay Critical
Dashboards are powerful, but nothing replaces hands-on testing. If your RUM data shows slow interactivity on mobile, test key user flows on an actual smartphone. If errors appear in a specific browser, reproduce the scenario directly. This helps you better understand user frustration and validate that your fixes truly improve the experience.
5 Common User Monitoring Mistakes to Avoid
Even the best real user monitoring tools can lead to confusion if the data is misinterpreted. Avoid these common mistakes.
1. Focusing Only on Averages
Averages can hide serious performance problems. If your average load time is 2 seconds, some users may still experience 5-second delays. Always look at percentiles, such as the 75th percentile, to understand how the majority of users experience your site.
2. Ignoring Sample Size
If a page has very little traffic, performance data may not be statistically reliable. Making decisions based on a small number of sessions can lead to unnecessary changes. Always consider traffic volume before drawing conclusions.
3. Treating RUM Like Synthetic Testing
Real user monitoring reflects real-world variability. Network speeds fluctuate, devices differ, and traffic patterns change. Don’t overreact to a single spike in performance data. Instead, analyze trends over time to make informed decisions.
4. Monitoring Performance Without Linking It to Business Impact
Performance metrics are important, but they should be connected to real outcomes. For example, if a slight delay on a blog post has no impact on engagement, it may not be urgent. However, if a delay on your checkout page reduces conversions, it becomes a priority.
5. Collecting Data Without Taking Action
Monitoring alone does not improve performance. If your RUM tools show poor Core Web Vitals on mobile, take steps to optimize images, reduce JavaScript, improve caching, or upgrade hosting resources. Real user performance monitoring is valuable only if it leads to measurable improvements.
How to Improve Performance Using a Real User Monitoring Tool
Real user monitoring tools can reveal real friction: slow pages, poor Core Web Vitals, geographic latency, or delayed interactivity. But data alone doesn’t fix performance. The smartest way to improve performance is to combine insights from your RUM tool with WP Rocket.
It’s the simplest and most powerful performance plugin for WordPress, handling 80% of performance best practices upon activation, including caching, GZIP compression, lazy rendering, critical image optimization, and CSS/JS minification.
Additionally, the intuitive interface allows you to enable powerful features like removing unused CSS, loading JavaScript deferred, and delaying JavaScript execution in just a few clicks — without touching any code and directly from WordPress. See for yourself, the interface is clean and streamlined, and you simply click on the options you want to activate to fix the issues flagged by your RUM tools:
Now let’s turn common RUM alerts into concrete fixes with WP Rocket!
RUM Flag: A Slow Loading Page (Mobile and Desktop)
If your real user performance monitoring tool shows certain pages loading slower than others, missing caching, or heavy server processing is often the cause.
🚀 Solution
Upon activation, WP Rocket applies caching and GZIP compression, reducing server processing time and improving Time to First Byte.
✅ Result
Faster load times, reduced server strain, and immediate site-wide speed improvements.
RUM Flag: Slow Performance in Australia (Servers in London)
If your RUM tools show slower load times for users far from your server location, you’re dealing with geographic latency.
🚀 Solution
Enable a CDN. WP Rocket integrates seamlessly with RocketCDN to distribute static assets globally so users load content from the nearest edge server.
✅ Result
Dramatically reduced latency, faster global delivery, and improved Core Web Vitals for international visitors.
RUM Flag: Poor Largest Contentful Paint (LCP)
If your Core Web Vitals report shows weak LCP scores, your largest visible element (often a hero image or banner) is loading too slowly.
🚀 Solution
Compress and convert images to WebP using Imagify, the easiest image optimization for WordPress that reduces file size without impacting image quality.
Upon activation, WP Rocket automatically applies critical image optimization and lazy rendering features to prioritize above-the-fold content.
✅ Result
Faster LCP, stronger SEO performance, and a better first impression for visitors.
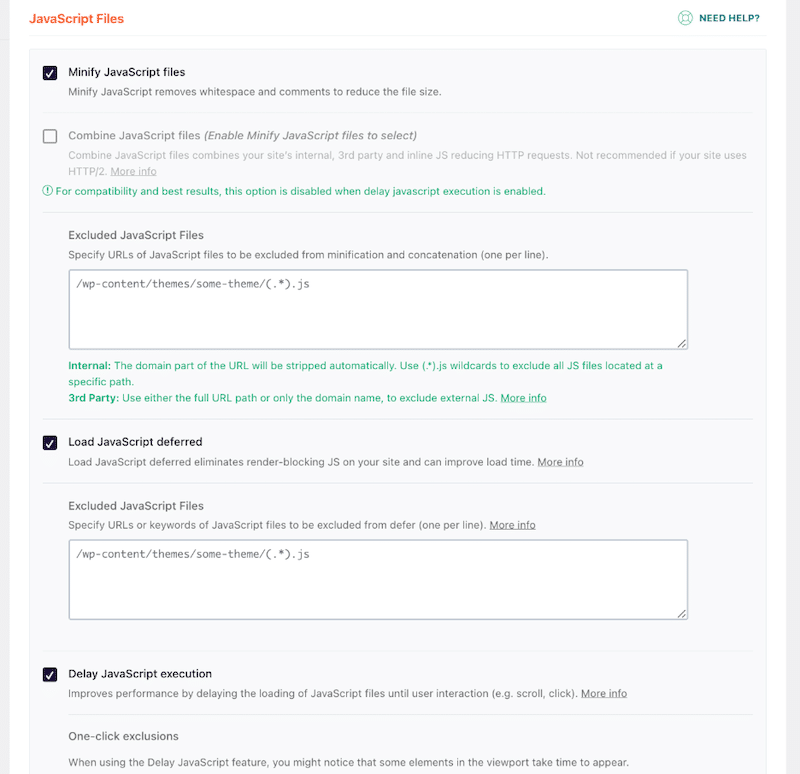
RUM Flag: Render-Blocking JavaScript (Poor INP or Delayed Interactivity)
If your real-user monitoring software shows delayed interactivity or low INP scores, JavaScript is likely blocking the browser’s main thread. When scripts load synchronously, the browser must download and execute them before rendering, delaying interactivity.
🚀Solution
Use WP Rocket to enable “Load JavaScript deferred” so scripts execute after HTML parsing instead of blocking it. Then enable “Delay JavaScript execution” to defer non-essential scripts until user interaction. This reduces main-thread blocking time and prioritizes critical content. This can be done in a couple of clicks from WP Rocket’s interface, no coding knowledge is needed:
✅ Result
Faster interactivity, improved INP scores, smoother navigation, and better real user performance monitoring metrics.
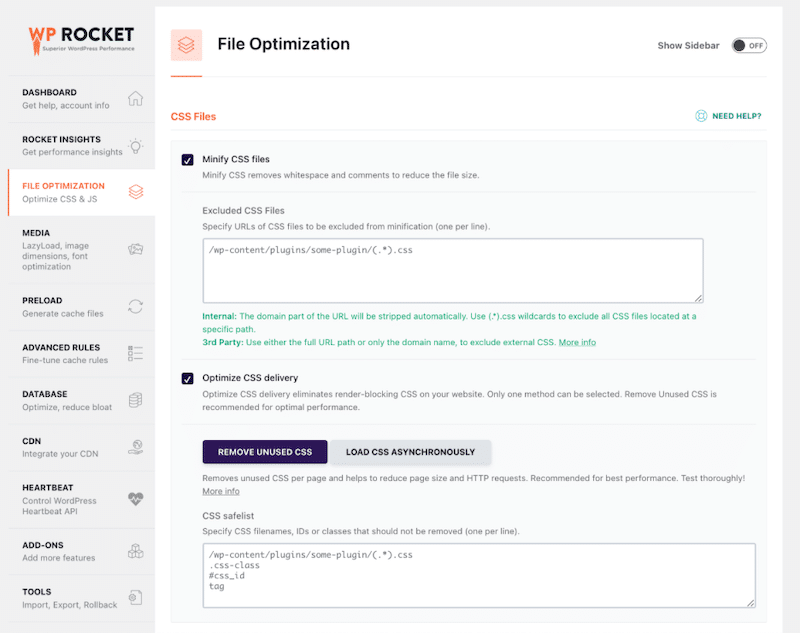
RUM Flag: CSS Delivery Issues
If pages load visually slowly, flash unstyled content, or feel unstable during rendering, CSS delivery may be the bottleneck.
🚀Solution
Activate “Remove Unused CSS” in WP Rocket to eliminate render-blocking styles and reduce file size.
✅ Result
Faster visual stability, improved Core Web Vitals, and a smoother loading experience.
Recap: Turning RUM Insights into Action
Below is a simplified overview of common issues flagged by real user monitoring software and the corresponding fixes in WP Rocket. WP Rocket features specifically fix the alerts coming from RUM tools, making it a practical and efficient solution for improving real user performance based on real-world data.
| Main Issues Detected by Real User Monitoring Software | 🚀Can WP Rocket help? |
| ✗ Slow loading pages (high TTFB, weak load times) | ✓ Page caching + GZIP compression |
| ✗ Slow performance for distant users (geographic latency) | ✓ CDN integration (RocketCDN compatibility) |
| ✗ Poor Largest Contentful Paint (LCP) | ✓ Automatic critical image optimization + Lazy rendering |
| ✗ Render-blocking JavaScript (poor INP) | ✓ Load JavaScript Deferred + Delay JavaScript Execution |
| ✗ CSS blocking rendering or visual instability | ✓ Remove Unused CSS + Optimized CSS delivery |
| ✗ Slow mobile performance | ✓ Mobile caching + JS/CSS optimization features |
| ✗ Server strain during traffic spikes | ✓ Caching reduces server processing load |
| 💡 Hint: WP Rocket is how you turn real user performance monitoring insights into measurable speed improvements, stronger Core Web Vitals, and higher conversions. |
FAQ Section
What is Real User Monitoring?
Real User Monitoring (RUM) is a performance tracking method that collects real-world data from actual visitors browsing your site. It measures what real customers experience across devices, browsers, networks, and locations. It shows you how your website truly performs in real-life conditions.
How is RUM Different from Synthetic Testing?
Synthetic testing measures your site in a controlled lab environment meaning that it simulates traffic from predefined devices and locations. On the contrary, RUM tools show reality and track actual visitors on your site. It requires a small JavaScript snippet and collects data from real users across different devices, browsers, connection speeds, and locations.
Which RUM Tools Are Best for Core Web Vitals?
Some of the best real user monitoring tools for Core Web Vitals include SpeedCurve, Datadog, and Chrome User Experience Report (along with GTmetrix for reporting, monitoring, and in-depth audits). Each tool has competitive advantages depending on whether you prioritize SEO visibility, trend monitoring, or full-stack performance insights.
Why Do RUM Metrics Vary Across Tools?
RUM metrics can vary for several reasons. First, some tools require you to install a JavaScript snippet on your site, while others (like the Chrome User Experience Report) rely on external Chrome data and don’t use your site’s own traffic directly. Second, performance depends on who is being measured. Are users in the US or Australia? On fiber or 4G? On desktop or mid-range mobile devices? Real user monitoring software reflects those differences, which is why numbers may vary between platforms.
How Often Should I Monitor Real User Performance?
Real user performance monitoring should be continuous. At a minimum, review your data weekly or monthly. You should also monitor closely before, during, and after major updates, such as launching a new product, redesigning your site, or running large campaigns like Black Friday.
Do Real User Monitoring tools improve website speed?
No, real user monitoring tools don’t directly improve speed; they identify issues. They are the first step in the optimization process. Once performance problems are flagged, you need to implement fixes. That’s where WP Rocket, the most powerful and easiest WordPress performance plugin, comes in to resolve issues flagged by RUM tools.
Wrapping Up
Real User Monitoring Tools show you what’s actually slowing real visitors down, not what a lab test predicts. They reveal slow pages, weak Core Web Vitals, geographic latency, frontend errors, and delayed interactivity under real-world conditions. But insights alone don’t improve performance.
That’s where WP Rocket comes in: the plugin helps you fix performance issues quickly — and without touching code. Caching, GZIP compression, JavaScript optimization, CSS delivery improvements, and critical image handling are all features designed to address the types of issues flagged by real-user monitoring software. Try WP Rocket risk-free with a 14-day money-back guarantee and speed upyour website right away!