
Table of Contents
Last update on
Want to understand what a website speed audit really is and how to run one correctly? You’re in the right place.
A website speed audit isn’t just a quick test. It’s a global performance approach where nothing is left to chance.
Maybe you’ve already run an audit and felt overwhelmed by red warnings, waterfall charts, and technical recommendations. What should you fix first? What actually matters?
We’re here to help.
In this guide, you’ll discover:
- What a real website speed audit includes
- The best website performance testing tools
- Common mistakes to avoid along with best practices for accurate testing
- And… how to fix the issues flagged by your audit
Because spotting problems is easy. Fixing them strategically is what makes the difference. With the right tools, improving your website’s speed isn’t daunting; it’s structured, actionable, and surprisingly simple.
Let’s dive in.
| TL;DR A website speed audit evaluates how quickly your site loads and renders content by analyzing load time, Core Web Vitals, and server response time (TTFB). It also examines resource loading in detail through waterfall charts, page weight, HTTP requests, and the impact of third-party scripts. All these metrics are then evaluated across different devices, connection speeds, and geographic locations to track long-term performance trends and detect issues across real-world scenarios. It matters because speed directly impacts SEO rankings, user experience, and revenue. Testing gives you insights, and monitoring keeps performance stable over time. The most important thing is to have an action plan (and the right tools) to fix the issues found during a website speed audit. |
Key Takeaways
✅ A website speed audit goes beyond a simple speed test; it analyzes performance over time, across devices, locations, and user conditions.
✅ Best practice include to test multiple pages, combining lab and field data, separating mobile from desktop, and testing from several locations.
✅ Avoid common mistakes like auditing only your homepage, relying only on lab data, or treating performance as a one-time task.
✅ Use the right tools for the right goal: PSI for quick checks, GTmetrix for deeper diagnostics, Uptrends for uptime monitoring, and Datadog for full observability.
✅ An audit alone doesn’t fix anything; applying optimizations with tools like WP Rocket is what turns red warnings into green scores.
What Is a Website Speed Audit?
A website speed audit is a complete evaluation of how fast your site loads, how it performs for users, and what’s slowing it down.
You simply enter your URL into a website performance testing tool, and it generates a dashboard powered by technologies like Lighthouse. You get a performance score (/100), Core Web Vitals metrics, load time data, grades, and color codes (green, orange, red). It looks like a report card for your site.
But it’s not just a one-shot test. Most advanced website performance testing tools also allow you to monitor performance over time, access historical data across weeks or months, and calculate averages to identify trends. Instead of relying on a single snapshot, you get long-term monitoring that shows whether your site is improving, degrading, or staying stable.
The real goal of a website performance audit is not just the score. It answers practical questions: Why is my site slow? What is hurting my SEO? Which issues affect users the most? What should I fix first?
Website Speed Audit vs Website Speed Test
A speed test measures one dimension of performance. A website speed audit evaluates the entire performance ecosystem and helps guide strategic decisions by collecting, analyzing, and monitoring data over time across devices, locations, traffic sources, and user behavior.
1. One-Time Website Speed Test
A website speed test measures speed and loading time at a specific moment. It tells you how fast your page loads right now, but does not tell you how performance evolves, how it impacts users globally, or how it affects your business metrics.
It’s ideal for quick checks and before/after comparisons.
✅ Example: You publish a new blog post and want to check whether it loads in under 2 seconds. You run a quick website speed test to confirm everything looks good.
Limitations:
- Only a single data point, no long-term trends
- Limited geographic insights and device segmentation
- It does not measure uptime, sessions, or conversion rates
- No explanation of deeper technical bottlenecks
- No monitoring or alert system
2. Full Website Performance Audit
A full website performance audit analyzes your site globally and in depth. It goes far beyond page speed and evaluates overall performance, stability, and business impact. It doesn’t just measure how fast a page loads. It also looks at uptime, response time, traffic volume, conversion rates, security KPIs, and traffic sources to determine which acquisition channels are truly efficient. This level of website performance analysis helps you prioritize actions based on real impact, not just technical scores.
Global Performance & Infrastructure Insights
A full website speed audit gives you contextual performance data across locations, devices, and servers.
✅ Example: You want to know how your site performs in Australia while your servers are in Paris. You run a 7-day website load time audit to collect average performance data. The results show higher latency in Sydney. Based on this insight, implementing caching and a CDN is a logical optimization.
Instead of reacting to a single data point, you base your decisions on context and trends.
Ongoing Monitoring & Alerts
Unlike a simple website speed test, a full audit often includes continuous monitoring. Monitoring ensures performance remains stable, especially after plugin updates, content changes, or traffic spikes.
✅ Example: When you create the pre-audit settings, you can set alerts if load time exceeds 3 seconds or if LCP crosses Google’s recommended threshold. It acts as a safety net.
A website performance audit can also measure uptime and alert you if your endpoints become unavailable. This allows you to resolve front-end issues before users are impacted.
UX & User Behavior Analysis
From a UX perspective, a full performance audit can also include session recordings and behavioral insights. You can identify friction points, abandoned steps, or repeated clicks caused by slow responses and apply those discoveries to product and design decisions.
This is particularly important for WooCommerce sites with dynamic content, frequent product additions, and ongoing updates.
Marketing & Revenue Impact
A full website performance audit also supports your digital marketing strategy. KPIs such as sessions, bounce rate, conversion rate, and traffic sources should be reviewed regularly to determine which acquisition channels are truly efficient.
✅ Example: If conversion rates drop while load time increases, performance may directly affect revenue.
| 💡 Hint: A website speed audit connects technical issues to real business impact, allowing you to fix what truly matters. |
What a Website Speed Audit Measures
A website speed audit measures and evaluates how your site performs technically and visually, not just at one moment, but over time. It analyzes load speed, rendering behavior, server performance, resource weight, third-party impact, device differences, and long-term performance trends. The goal isn’t just to measure speed, it’s to understand what influences it, how it evolves, and what needs improvement first.
1. Load Time & Rendering
What it measures: How quickly your page becomes visible and usable.
Load time measures how quickly the full page loads, while rendering metrics gauge how quickly users see meaningful content.
2. Core Web Vitals
What it measures: Real-world user experience and Google ranking signals.
Core Web Vitals include Largest Contentful Paint (when the main content appears), Interaction to Next Paint (how fast the page responds to clicks), and Cumulative Layout Shift (visual stability). These metrics directly impact SEO and user satisfaction.
3. Server Response Time (TTFB)
What it measures: How quickly your server starts delivering content.
A high TTFB may signal slow hosting, missing caching, or heavy server-side processing.
4. Waterfall Charts for Resource Loading
What it measures: The loading order and blocking behavior of every resource.
A waterfall chart shows which scripts, images, or files load first, which ones block rendering, and how long each request takes. It helps identify bottlenecks visually.
5. Page Weight Distribution & HTTP Requests
What it measures: How heavy your page is and how many resources it loads.
A website performance audit breaks down the total size by images, JavaScript, CSS, and fonts. It also shows the number of HTTP requests. For example, 120 requests and 6MB of assets may explain slow performance.
6. Third-Party Impact
What it measures: The performance cost of external scripts and tools.
Analytics tags, ads, chat widgets, and tracking pixels can delay rendering and affect interactivity. An audit quantifies their impact so you can evaluate trade-offs.
7. Device & Connection Segmentation
What it measures: Performance differences across devices and network types.
A full website speed audit analyzes performance on iPhone, Android, and desktop devices, across Wi-Fi, 4G, and 5G connections. A site that loads in 1.8 seconds on desktop Wi-Fi may take 3.5 seconds on a mid-range Android over 4G.
8. Long-Term Performance Trends
What it measures: Performance evolution over time.
Instead of a single snapshot, an audit tracks trends across days, weeks, or months. If performance drops after a plugin update or traffic spike, monitoring reveals it early.
How to Run a Website Speed Audit Correctly
Here are the best practices to follow to ensure your website performance audit produces meaningful results and leads to concrete actions.
1. Test Multiple Pages and Templates
Don’t audit just your homepage; always audit high-traffic and high-conversion pages.
Your blog template, WooCommerce product pages, landing pages, and checkout flow may load very differently. Each template has its own scripts, images, and dynamic content.
✅ Example: Your homepage scores 92/100, but your WooCommerce product page loads 2 seconds slower because of image galleries and variation scripts. If you only test the homepage, you’ll miss the real issue and maybe impact your revenue.
2. Use Both Lab Data and Real-User Data
Lab data (simulated tests) is useful for controlled analysis. Real-user (field) data shows how your site performs for actual visitors. Lab data helps identify technical bottlenecks while field data confirms whether those issues affect real users.
✅ Example: Your lab test shows a 2.1s LCP, but real-user data reveals that mobile users experience 3.2s. That difference changes your priorities.
3. Separate Mobile and Desktop Results
Desktop results are not mobile results. Mobile devices have slower CPUs and different rendering behavior. Always separate performance by device and test on multiple real-world devices, such as an iPhone 15, a mid-range Android phone, and different screen sizes.
✅ Example: Your site loads in 1.8 seconds on desktop Wi-Fi but 3.5 seconds on a mid-range Android using 4G. Without segmentation, you wouldn’t detect the problem, right?
4. Test Different Network Conditions
Do not test only on fast Wi-Fi; performance must be evaluated under realistic constraints. Your users may browse on 4G, 5G, or unstable mobile networks. A proper website load-time audit simulates slower connections to reflect real-world conditions.
✅ Example: Your landing page feels instant on fiber internet, but on 4G, the hero image delays rendering by 2 seconds, hurting conversions.
5. Audit After Every Major Update
Performance changes when your site is modified; therefore, performance auditing should be part of your update workflow. After installing a plugin, changing themes, launching a campaign, or adding new content, run a new website speed audit.
✅ Example: You install a marketing pop-up plugin. A new audit reveals that adding JavaScript increases main-thread blocking time. Without auditing again, you wouldn’t notice the impact.
6. Monitor Performance Over Time
A single audit is not enough because performance evolves due to traffic spikes, server load, or content growth. Ongoing monitoring ensures your site remains stable.
✅ Example: Your site performs well today, but during Black Friday traffic, load time exceeds 3 seconds. Monitoring alerts you before revenue is affected.
7. Focus on Impact, Not Just Global Performance Scores
A 100/100 score is not the ultimate goal. You should also prioritize fixes that improve user experience and conversions, especially those that address Core Web Vitals and load times on key pages.
✅ Example: Improving LCP on your checkout page from 3.1s to 2.3s may increase conversions, even if your overall score only increases slightly.
4 Website Speed Audit Tools You Should Use
Different tools cover different parts of a website speed audit: some give you a quick diagnostic snapshot while others provide deep technical insights, global monitoring, or full observability across your stack. Understanding what each tool measures — and what it doesn’t — helps you build the right performance toolkit.
1. PageSpeed Insights (PSI)
Focus: Quick diagnostic snapshot
What it measures:
- Core Web Vitals (lab + field data if traffic exists)
- Performance score (/100)
- Mobile vs desktop comparison
- Optimization suggestions & passed audits
Monitoring & alerts:
None.
Limitations:
- No geographic test selection
- No advanced device simulation
- No network customization
- No monitoring or alert system
Best for:
SEO specialists, marketers, and anyone who wants a fast Google-aligned performance overview with a clear to-do list.
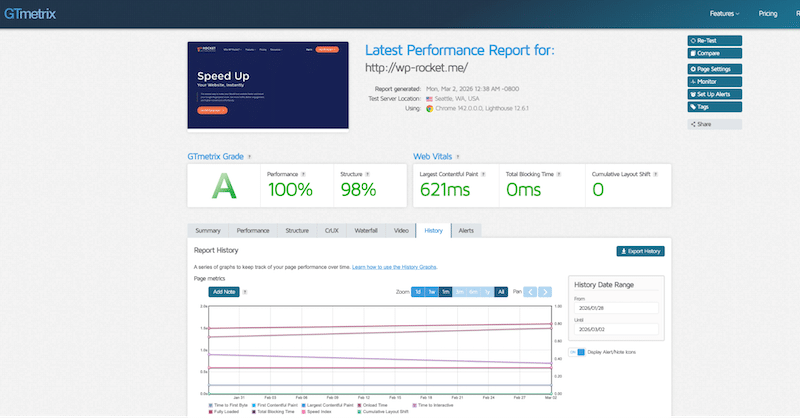
2. GTmetrix
Focus: Deep technical insights, simplified reporting
What it measures:
- Core Web Vitals (lab data)
- Waterfall charts
- Page weight breakdown (% images, JS, CSS, video, etc.)
- Number of HTTP requests
- Historical performance tracking
- Competitor URL comparison
Advanced testing capabilities:
- Multi-device testing (e.g., iPhone 15, desktop)
- Network simulation
- Geographic test locations
Monitoring & alerts:
Yes, you can configure alerts (e.g., send an email if a page takes more than 4 seconds to load).
Best for:
Developers, agencies, and technical marketers who want deeper diagnostics than PSI while keeping reports easy to interpret.
3. Uptrends
Focus: Availability & SLA monitoring (SLA stands for Service Level Agreement. It defines performance and availability targets (for example, 99.9% uptime). Uptrends allows you to track whether your site meets those targets and generate reports showing compliance over time.
What it measures:
- Uptime monitoring (you can define uptime/performance targets and receive alerts when thresholds are exceeded)
- Global response times
- Core Web Vitals
- SLA tracking and reporting
- Record and test real user flows (login, add to cart, checkout) in a real browser environment.
- Test availability and response times from multiple worldwide checkpoints.
Monitoring & alerts:
Strong alerting system with configurable thresholds and escalation workflows.
Best for:
E-commerce businesses, high-traffic websites, and companies that depend on uptime guarantees and performance commitments.
4. Datadog
Focus: Full performance ecosystem
What it measures:
- Real User Monitoring (RUM)
- Core Web Vitals (Frontend performance at the user level correlated with backend performance)
- Infrastructure metrics with synthetic testing, uptime checks and infrastructure monitoring
- Logs and traces
- Synthetic monitoring & uptime
- User actions (e.g., checkout clicks) and detect UX friction, such as rage clicks
Monitoring & alerts:
Advanced alerting, anomaly detection, and customizable dashboards.
Best for:
SaaS companies, DevOps teams, and large WooCommerce or enterprise sites need full-stack observability.
Website Speed Audit Tools Comparison
If you are a visual learner, here’s a quick recap about the best Website performance testing tools:
| Website performance testing tools | Focus | Core Web Vitals | Multi-Device & Geographic Testing | Monitoring & Alerts |
| PageSpeed Insights | Quick diagnostic snapshot | Yes (lab + field if traffic) | No advanced controls | No |
| GTmetrix | Deep technical insights, simplified reporting | Yes (lab) | Yes (device, location, network) | Yes |
| Uptrends | Availability & SLA monitoring | Limited (via RUM) | Yes (global checkpoints) | Yes (advanced) |
| Datadog | Full performance ecosystem | Yes (via RUM) | Yes (synthetic + segmentation) | Yes (advanced) |
6 Common Website Speed Audit Mistakes to Avoid
Running a website speed audit is strategic, but only if you use the testing tools correctly. Many site owners rely on incomplete data or one-off website speed tests, which can miss critical performance issues. Avoid these 6 common mistakes to make your website performance audit truly effective:
1. Auditing Only the Homepage
Your homepage is not your entire website. Many businesses run a website speed test on the homepage and assume everything is fine. In reality, product pages, blog posts, landing pages, and checkout flows often behave very differently. A proper website performance analysis should include multiple page types, especially high-traffic and high-conversion pages.
2. Ignoring Mobile Results
Mobile performance is often significantly different from desktop performance. If your website speed audit focuses mainly on desktop scores, you’re missing critical insights. You should test on several real devices, for example, an iPhone 15, a mid-range Android device, and different screen sizes, not just a single simulated environment. Device performance, CPU power, and browser differences all impact load time and responsiveness. Always analyze mobile data separately during your website load time audit.
3. Treating Audits as One-Time Tasks
A website performance audit is not a one-time project. Performance changes over time — after plugin updates, content additions, traffic spikes, or marketing campaigns. Running a single website speed test and stopping there leaves you blind to future issues. Website performance monitoring should be continuous.
4. Testing Only on Wi-Fi
Testing your site only on a fast Wi-Fi connection gives you an unrealistic view. Many users browse on 4G or slower networks. A complete website speed audit should simulate different connection scenarios and geographic locations. Performance must be evaluated under real-world conditions, not ideal ones.
5. Relying Only on Lab Data
Lab data is useful, but incomplete. Many website performance testing tools provide results based on simulated environments. Field data, however, shows how your site performs for real users. A comprehensive website performance audit combines both lab and real-world metrics.
6. Forgetting to Set Up Monitoring and Alerts
Auditing without monitoring is like diagnosing without follow-up. If you don’t configure alerts for load-time increases or Core Web Vitals drops, you may not detect issues until they affect SEO or conversions. A proper website speed audit includes ongoing monitoring and notifications.
How to Fix Issues Found in a Website Speed Audit
So, you’ve run your website speed audit. You’ve seen the scores, the charts, the red warnings. You even know the mistakes to avoid! Now what?
Running a website performance audit is useful, but only if you turn insights into actions. Here’s a practical workflow to fix the issues you’ve identified:
1. Identify the Main Bottlenecks
Start by reviewing your key performance indicators and diagnostic tools. Check the waterfall chart, look at Core Web Vitals, and analyze page weight and HTTP requests.
Ask yourself:
- Are any Core Web Vitals in the red?
- Is LCP above 2.5 seconds?
- Is INP delayed?
- Is TTFB too high?
- Do you have too many HTTP requests?
✅ Example:
If your LCP is in the red, check what element is considered the largest contentful element. If it’s a hero image and it’s oversized or uncompressed, image optimization should be your first step.
If you notice a high number of HTTP requests, your JavaScript or CSS may not be optimized. Too many scripts loading at once can block rendering and delay interactivity.
The goal is to connect each metric to a specific technical issue.
2. Prioritize Issues by Impact
Not all performance issues are equal.
Most website performance testing tools (like GTmetrix or Lighthouse-based tools) categorize recommendations as low, medium, or high impact.
Start with:
- High-impact issues
- Red scores
- Core Web Vitals failures
✅ Example:
If your tool flags “Reduce initial server response time” as high priority, fix that before optimizing minor font loading issues.
A good website performance analysis focuses on what will produce the biggest improvement first.
3. Apply Performance Optimizations
Once bottlenecks are identified and prioritized, apply targeted optimizations.
✅ Examples based on common audit findings:
- If your site loads slowly in Australia while your servers are in Paris, implementing caching and a CDN can reduce latency.
- If your LCP is high because of a large image, compress it, convert it to modern formats, and ensure it’s properly sized.
- If JavaScript is blocking rendering, defer or delay non-essential scripts.
- If your page has too many HTTP requests, reduce unused CSS, combine assets where possible, and remove unnecessary plugins.
- If TTFB is high, enable page caching and optimize server configuration.
Every measurable KPI should be matched with a concrete action for optimization.
4. Re-Test and Validate Improvements
After applying optimizations, run a new website speed test or repeat your website load time audit.
Time to run another check:
- Are Core Web Vitals now in the green?
- Has your performance score improved?
- Has LCP dropped below 2.5 seconds?
- Has TTFB decreased?
✅ Example:
If you fix image optimization issues, your LCP should move from red to green in PageSpeed Insights. Retesting validates that your changes had a real impact.
| 💡 Hint: Performance optimization is iterative: Audit → Fix → Re-test → Monitor. |
Common Website Speed Audit Bottlenecks & Fixes (Cheat Sheet)
Below is a simplified overview of common issues identified during a website speed audit, along with the corresponding performance optimizations you can apply.
| Bottleneck Identified in Audit | Performance Optimization to Apply |
| High LCP (Largest Contentful Paint) | Optimize and compress large images, preload critical assets |
| Poor INP – Delayed Interactivity | Defer or delay non-essential JavaScript |
| High CLS (Cumulative Layout Shift) | Define image dimensions and stabilize layout elements |
| High TTFB (Server Response Time) | Enable page caching, optimize hosting/server configuration |
| Too Many HTTP Requests | Reduce unused CSS/JS, remove unnecessary plugins |
| Heavy Page Weight (Images, Scripts) | Compress images, minify CSS/JS, remove unused assets |
| Slow Performance in Specific Regions | Implement a CDN and caching strategy |
| Third-Party Scripts Blocking Rendering | Delay or selectively load third-party scripts |
A website performance audit helps you identify these bottlenecks, but the real progress happens when you apply the right optimization to the right issue. The good news? Many of these performance optimizations can be implemented quickly and efficiently, without touching code. Let’s take a look at a practical solution: WP Rocket. 🚀
How WP Rocket Helps You After a Website Speed Audit
A website speed audit tells you what’s wrong. The next step is fixing it efficiently.
That’s where WP Rocket comes in.
WP Rocket is one of the most powerful performance plugins for WordPress because it automatically applies around 80% of performance best practices upon activation, addressing most bottlenecks commonly identified during a website performance audit.
Out of the box, it enables:
- Page caching
- GZIP compression
- CSS & JavaScript minification
- Optimization of critical images above the fold
- Automatic lazy rendering
🚀 These optimizations alone resolve a large portion of the issues typically flagged during a website load-time audit.
And it doesn’t stop there.
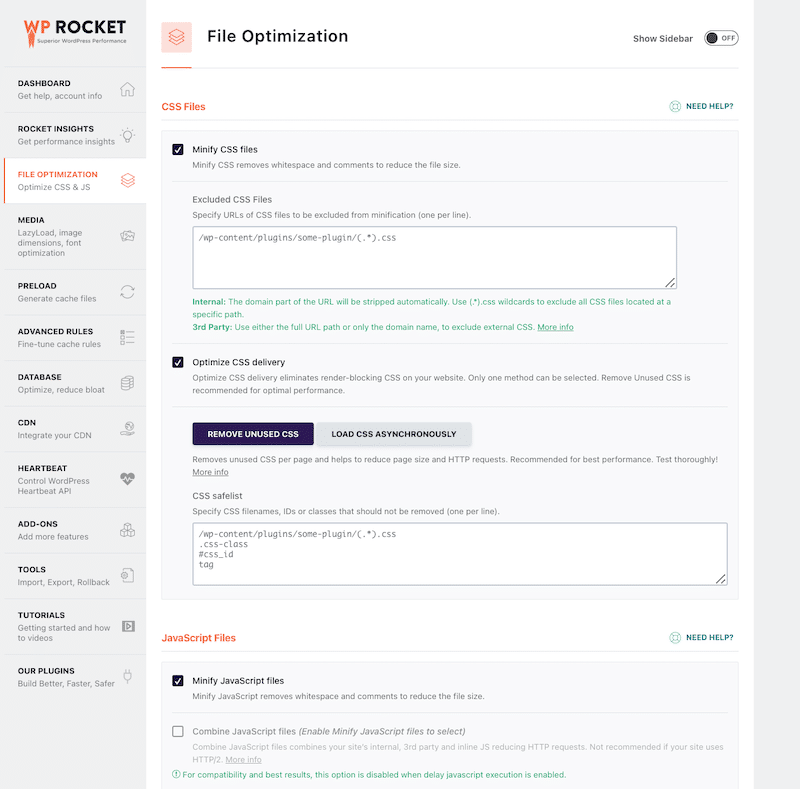
Its intuitive interface allows you to activate advanced features in just a few clicks — without touching a single line of code:
- Remove Unused CSS
- Load JavaScript deferred
- Delay JavaScript execution
See? Maintaining a healthy performance audit becomes much easier when WP Rocket handles optimization!
From Audit to Optimization: Practical Overview
Below is how common bottlenecks identified during a website speed audit can be addressed using WP Rocket.
| Bottleneck Identified in Audit | Performance Optimization to Apply | How WP Rocket Helps |
| High TTFB (Server Response Time) | Enable caching and compression | ✔ Page caching, GZIP compression and database optimization |
| Poor LCP (Largest Contentful Paint) | Optimize above-the-fold content | ✔ Caching, automatic optimization of critical images, lazy rendering, GZIP compression, minify CSS & JS, remove unused CSS, defer JavaScript, delay JavaScript execution, preload critical assets and preconnect to third-party domains |
| Render-blocking JavaScript (Poor INP) | Defer or delay scripts | ✔ Load JavaScript deferred and delay JavaScript execution |
| CSS Blocking Rendering | Optimize CSS delivery | ✔ Remove unused CSS |
| Too Many HTTP Requests | Reduce unnecessary assets | ✔ CSS and JS minification, remove unused CSS, delay and defer JS files, lazy loading |
| Heavy Page Weight | Reduce resource size | ✔ Caching, GZIP compression, CSS and JS minification, lazy rendering, remove unused CSS, defer JavaScript, delay JavaScript execution, font optimization among others |
| Slow Performance in Specific Regions | Reduce latency | ✔ Compatible with CDN integration like RocketCDN |
How to Monitor Website Performance After an Audit
Running a website speed audit is only the first step. Maintaining performance over time requires continuous monitoring. Your site may score 100/100 today. It may load in under 2 seconds right now. But what about next week? After a plugin update? After adding new images? During a traffic spike? Performance is not static. It evolves.
That’s why website performance monitoring is essential for preserving long-term speed improvements, and why it should be aligned with your marketing strategy.
Manual Monitoring
Manual monitoring means regularly reviewing your key performance indicators.
You should periodically:
- Run a website speed test on key pages
- Check Core Web Vitals
- Monitor load time on mobile and desktop
- Review uptime reports
- Analyze conversion rates alongside speed metrics
Performance monitoring should not reside solely with the technical team; it must also involve marketing.
For example, if Black Friday is coming and you’re launching a new landing page, ask:
- Are we expecting a traffic spike?
- Is the landing page optimized for mobile?
- Has it been tested under load?
- Is uptime monitored?
If your promotion drives thousands of visitors, but the page loads slowly or crashes, performance becomes a revenue issue, not just a technical one.
Automatic Monitoring
Manual checks are useful, but automation provides security.
Automatic website performance monitoring allows you to:
- Set alerts if load time exceeds a threshold (e.g., 3 seconds)
- Receive notifications if Core Web Vitals drop below recommended values
- Get email alerts if your site goes down
- Detect performance degradation after updates
Instead of discovering problems through lost traffic or customer complaints, you’re notified immediately. Automatic monitoring acts as a safety net. It protects the improvements identified during your website performance audit and ensures they remain stable over time.
FAQ
What is a website speed audit?
A website speed audit is a complete performance evaluation that analyzes how fast your site loads, how it behaves over time, and what’s slowing it down. It provides a big-picture view, including Core Web Vitals, server response time, page weight, device differences, and a prioritized to-do list for optimization.
How often should I run a website speed audit?
You should run a website speed audit after major changes, such as plugin installations, theme updates, content additions, or before launching a large promotion like Black Friday. For active websites, weekly and monthly monitoring is a smart best practice to ensure long-term stability.
What’s the difference between a speed audit and a speed test?
A speed test measures performance at a specific moment with limited settings. A website speed audit goes further by analyzing devices, network conditions, geographic locations, historical data, and waterfall charts. An audit provides context and long-term insights rather than just a snapshot.
Which tools are best for a website speed audit?
PageSpeed Insights is ideal for quick Google-aligned checks. GTmetrix provides deeper diagnostics with waterfall charts and advanced testing controls. Uptrends focuses on uptime and global monitoring. Datadog offers full-stack observability and real user monitoring. The most effective strategy often combines multiple tools.
Do website speed audits improve performance on their own?
No. A website speed audit identifies issues but does not fix them. To resolve bottlenecks such as high TTFB, poor LCP, or render-blocking scripts, you need to apply performance optimizations. Tools like WP Rocket make implementing those fixes simple and efficient.
How long does a website speed audit take?
Getting results from a website speed test is almost instant. Monitoring trends may take days or weeks to gather meaningful data. If fixes are implemented manually, the process can take longer. With a performance plugin like WP Rocket, many optimizations can be applied immediately.
Wrapping Up
Long-term performance is not about achieving a high score once. It’s about maintaining speed, stability, and user experience, especially when traffic grows or marketing campaigns launch. A website speed audit helps you diagnose and monitor performance, keeping you in control and flagging issues that need to be resolved.
🚀 WP Rocket is the easiest way to fix the issues identified by website speed monitoring tools. That’s how you move from red warnings to sustainable, high-performing websites easily.
Time to run a full website speed audit and implement most performance fixes with WP Rocket! Plus, it comes with a 14-day money-back guarantee, meaning no risk involved!